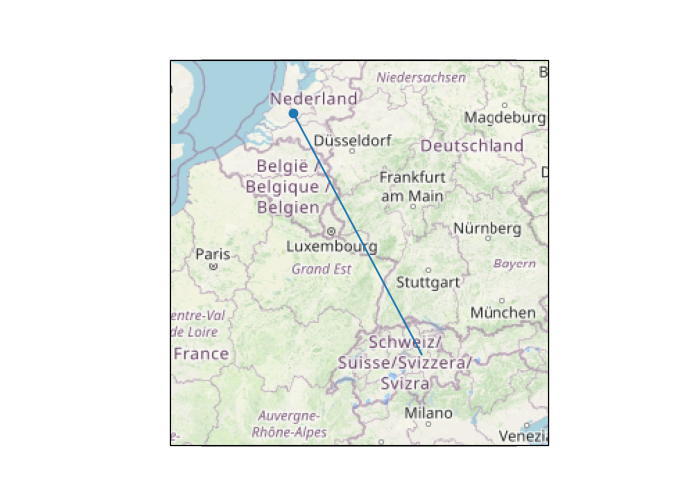
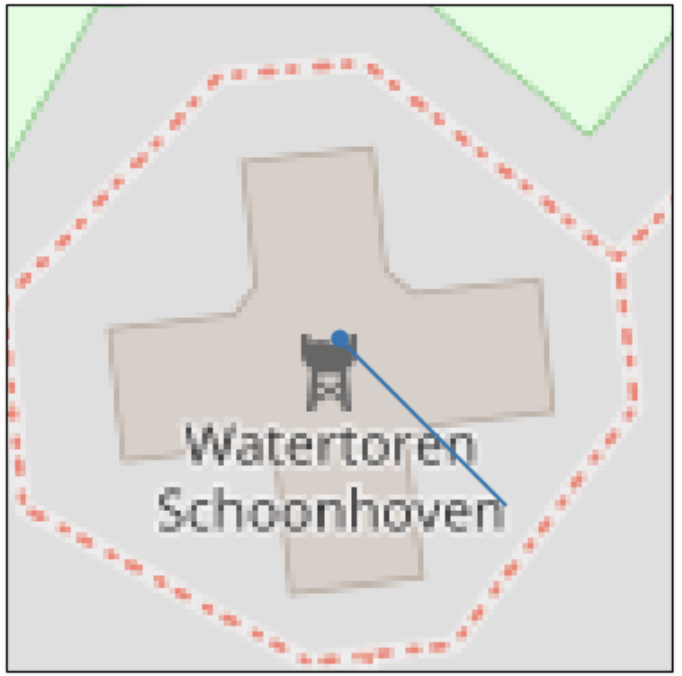
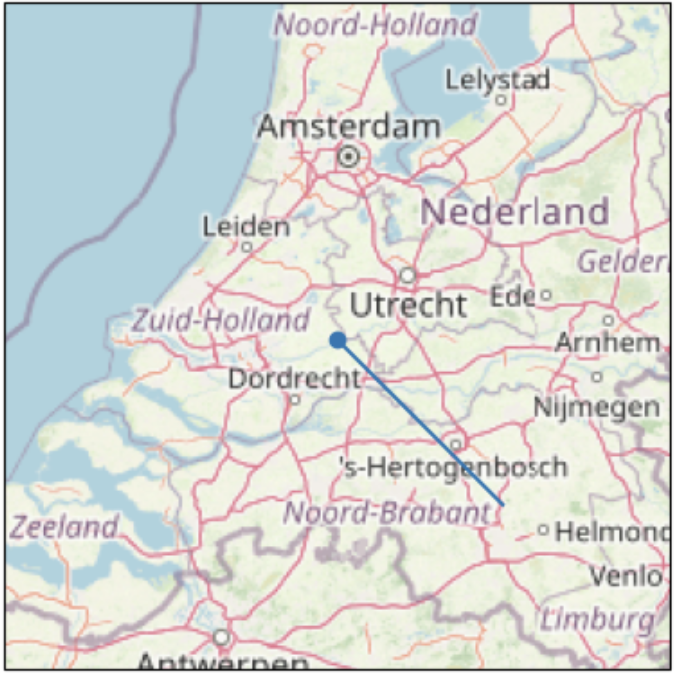
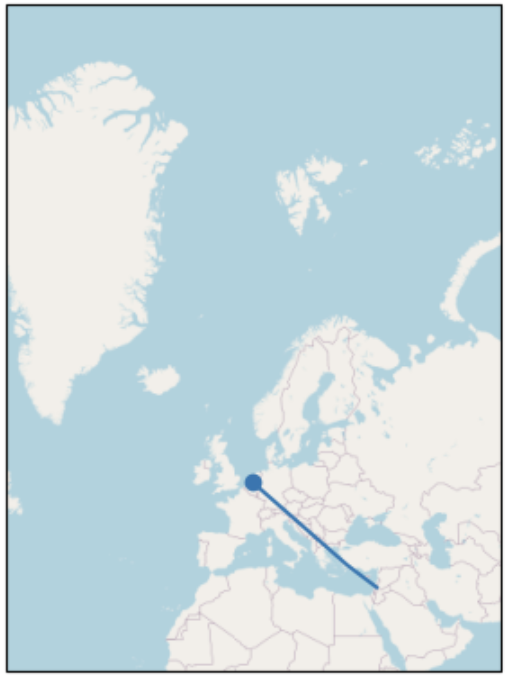
There are many libraries today that can do this for you - smopy, folium and tilemapbase are three examples from my recent use.
Each of these tools fetch map tiles from the one of several servers that host OSM or other (Stamen, Carto, etc) map tiles and then allows you to display and plot on them using matplotlib. Tilemapbase also caches the tiles locally so that they are not fetched again the next time.
But there does not seem to be a readily available tool yet, based on my recent experience, to use offline tilesets (such as a compressed .mbtiles file) as background for matplotlib plotting.
This link contains a survey of the above tools and more - https://github.com/ispmarin/maps
EDIT
I had mentioned in my previous answer that Tilemapbase did not work for some geographical locations in the world, and hence explicitly recommended not to use it. But it turns out I was wrong, and I apologize for that. It actually works great! The problem in my case was embarrassingly simple - I had reversed the order or lat and lon while fetching tiles, and hence it always fetched blank tiles for certain geographical locations, leading me to assume that it did not work for those locations.
I had raised the issue in github and it was immediately resolved by the developers. See it here - https://github.com/MatthewDaws/TileMapBase/issues/7
Note the responses:
Coordinates are to be provided in order (1) longitude, (2) latitude. If you copied them from Google Maps, they will be in lat/lon order and you have to flip them. So your map image is not empty, it's just a location in the ocean north of Norway.
And from the developer himself:
Yes, when I wrote the code, it seemed that there wasn't a universal standard for ordering. So I chose the one which is different to Google Maps. The method name from_lonlat should give a hint as to the correct ordering...


