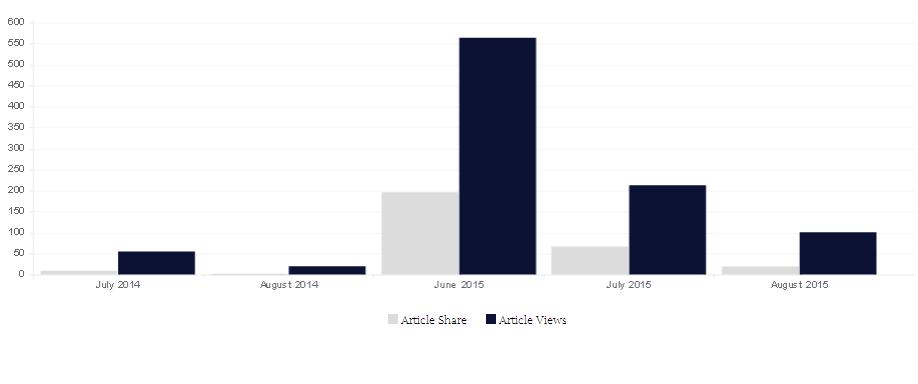
I am creating a bar chart using chart.js. but this chart look blurry in my screen. Below is my html and js code:
<canvas id="myChart" style="padding-left: 0;padding-right: 0;margin-left: auto; margin-right: auto; display: block;width: 90%;height:350px;"></canvas>
Js Code for create chart bar:
window.onload = function () {
var data = {
labels: [],
datasets: [
    {
        label: "My First dataset",
        fillColor: "rgba(220,220,220,2)",
        strokeColor: "rgba(220,220,220,2)",
        pointColor: "rgba(220,220,220,2)",
        pointStrokeColor: "#fff",
        pointHighlightFill: "#fff",
        pointHighlightStroke: "rgba(220,220,220,2)"
    },
    {
        label: "My Second dataset",
        fillColor: "rgba(12, 18, 51, 1)",
        strokeColor: "rgba(12, 18, 51, 1)",
        pointColor: "rgba(12, 18, 51, 1)",
        pointStrokeColor: "#fff",
        pointHighlightFill: "#fff",
        pointHighlightStroke: "rgba(12, 18, 51, 1)"
    }
]
};

var ctx = jQuery("#myChart")[0].getContext('2d');
var options = {
scaleBeginAtZero : true,
scaleShowGridLines : true,
scaleGridLineColor : "rgba(0,0,0,.05)",
scaleGridLineWidth : 1,
scaleShowHorizontalLines: true,
scaleShowVerticalLines: false,
barShowStroke : true,
barStrokeWidth : 2,
barValueSpacing : 10,
barDatasetSpacing : 1,

legendTemplate : "<ul class=\"<%=name.toLowerCase()%>-legend\"><% for (var i=0; i<datasets.length; i++){%><li><span style=\"background-color:<%=datasets[i].fillColor%>\"></span><%if(datasets[i].label){%><%=datasets[i].label%><%}%></li><%}%></ul>"

}
var myLineChart = new Chart(ctx).Bar(data, options);
<?php foreach($resultGraph as $share){?>

myLineChart.addData([<?php echo $share->shCOunt;?>, <?php echo $share->tt;?>], "<?php echo $share->post_date1;?>");
<?php } ?>

//myLineChart.addData([30, 50], "January");

}

</script>

