How to tune spark job on EMR to write huge data quickly on S3
Asked Answered
J

2

20

I have a spark job where i am doing outer join between two data frames . Size of first data frame is 260 GB,file format is text files which is split into 2200 files and the size of second data frame is 2GB . Then writing data frame output which is about 260 GB into S3 takes very long time is more than 2 hours after that i cancelled because i have been changed heavily on EMR .

Here is my cluster info .

emr-5.9.0
Master:    m3.2xlarge
Core:      r4.16xlarge   10 machines (each machine has 64 vCore, 488 GiB memory,EBS Storage:100 GiB)

This is my cluster config that i am setting

capacity-scheduler  yarn.scheduler.capacity.resource-calculator :org.apache.hadoop.yarn.util.resource.DominantResourceCalculator
emrfs-site  fs.s3.maxConnections:   200
spark   maximizeResourceAllocation: true
spark-defaults  spark.dynamicAllocation.enabled:    true

I tried setting memory component manually also like below and the performance was better but same thing it was taking again very long time

--num-executors 60--conf spark.yarn.executor.memoryOverhead=9216 --executor-memory 72G --conf spark.yarn.driver.memoryOverhead=3072 --driver-memory 26G --executor-cores 10 --driver-cores 3 --conf spark.default.parallelism=1200

I am not using default partition to save data into S3 .

Adding all details about the jobs and query plan so that it will be easy to understand .

The real reason is partition .And that is taking most of the time. Because i have 2K files so if i use re partition like 200 the output files comes in lakhs and then loading again in spark is not a good story .

In below image i dont know why sort is again called after project enter image description here
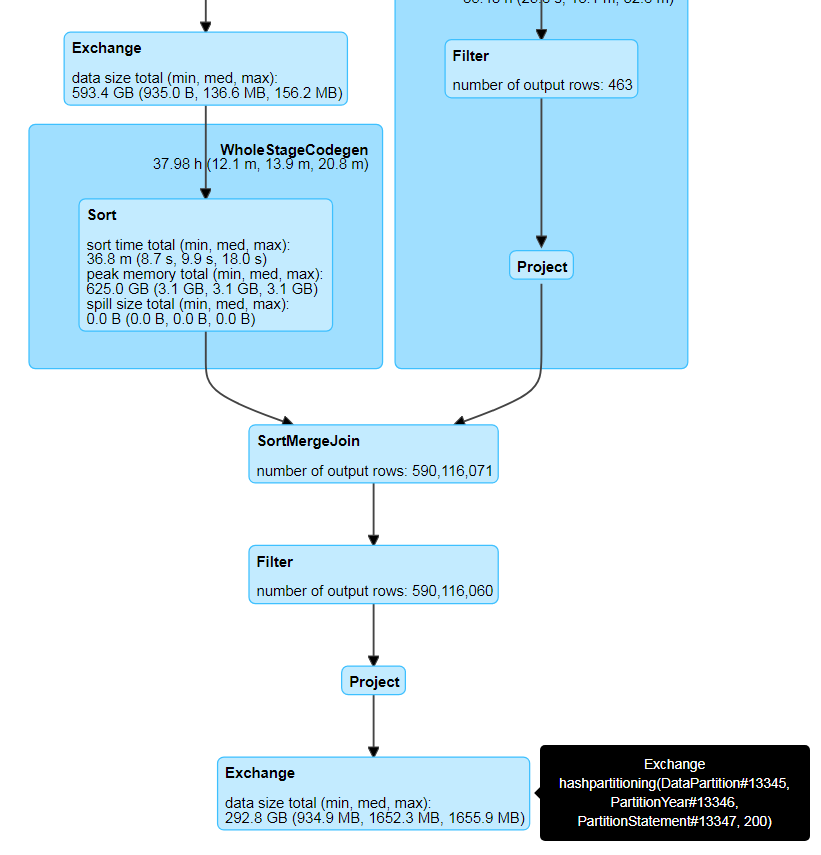
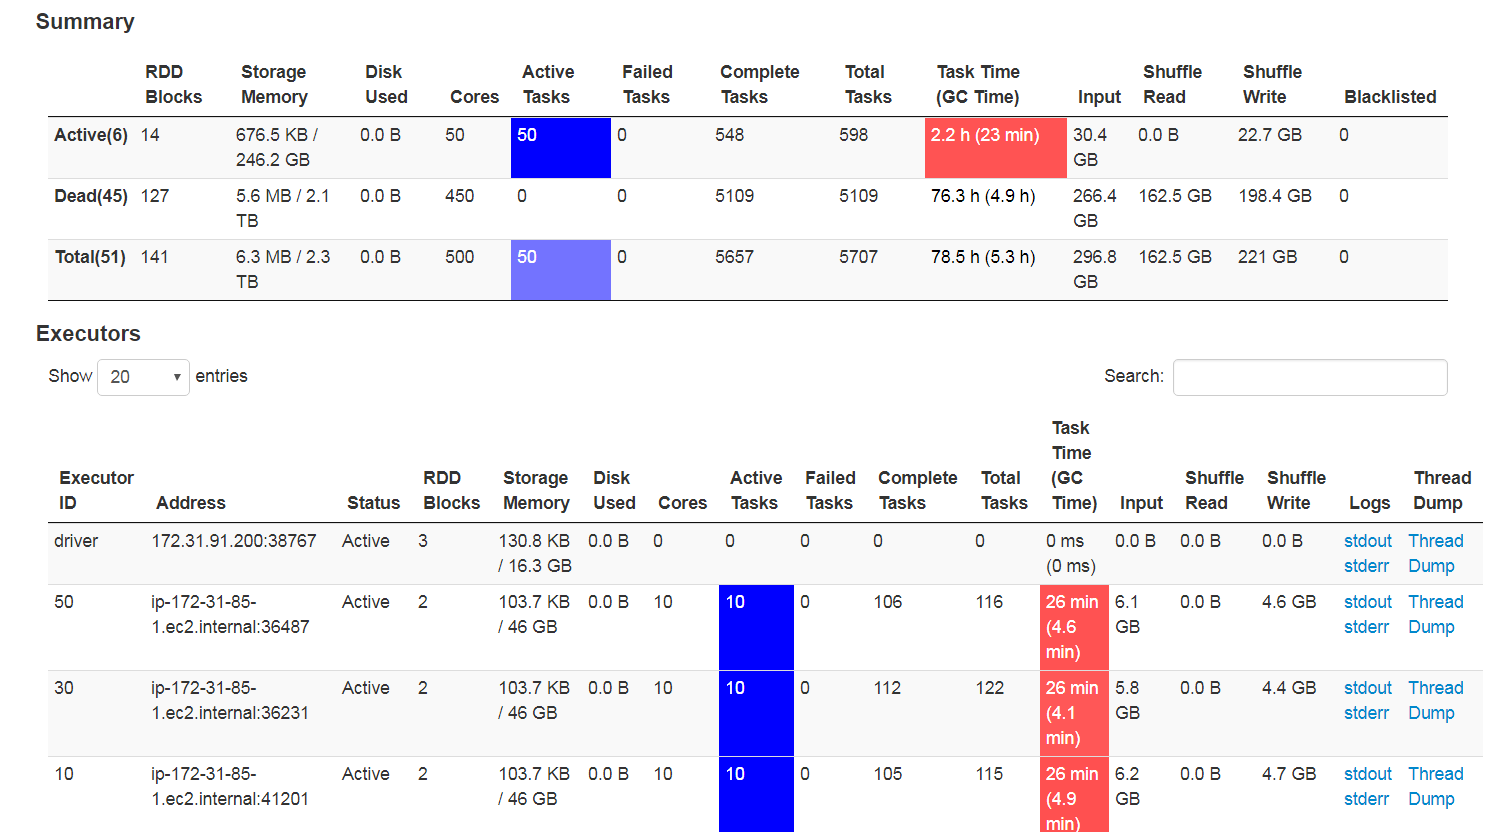
In below Image GC is too high for me ..Do oi have to handle this please suggest how? Executor and GC details
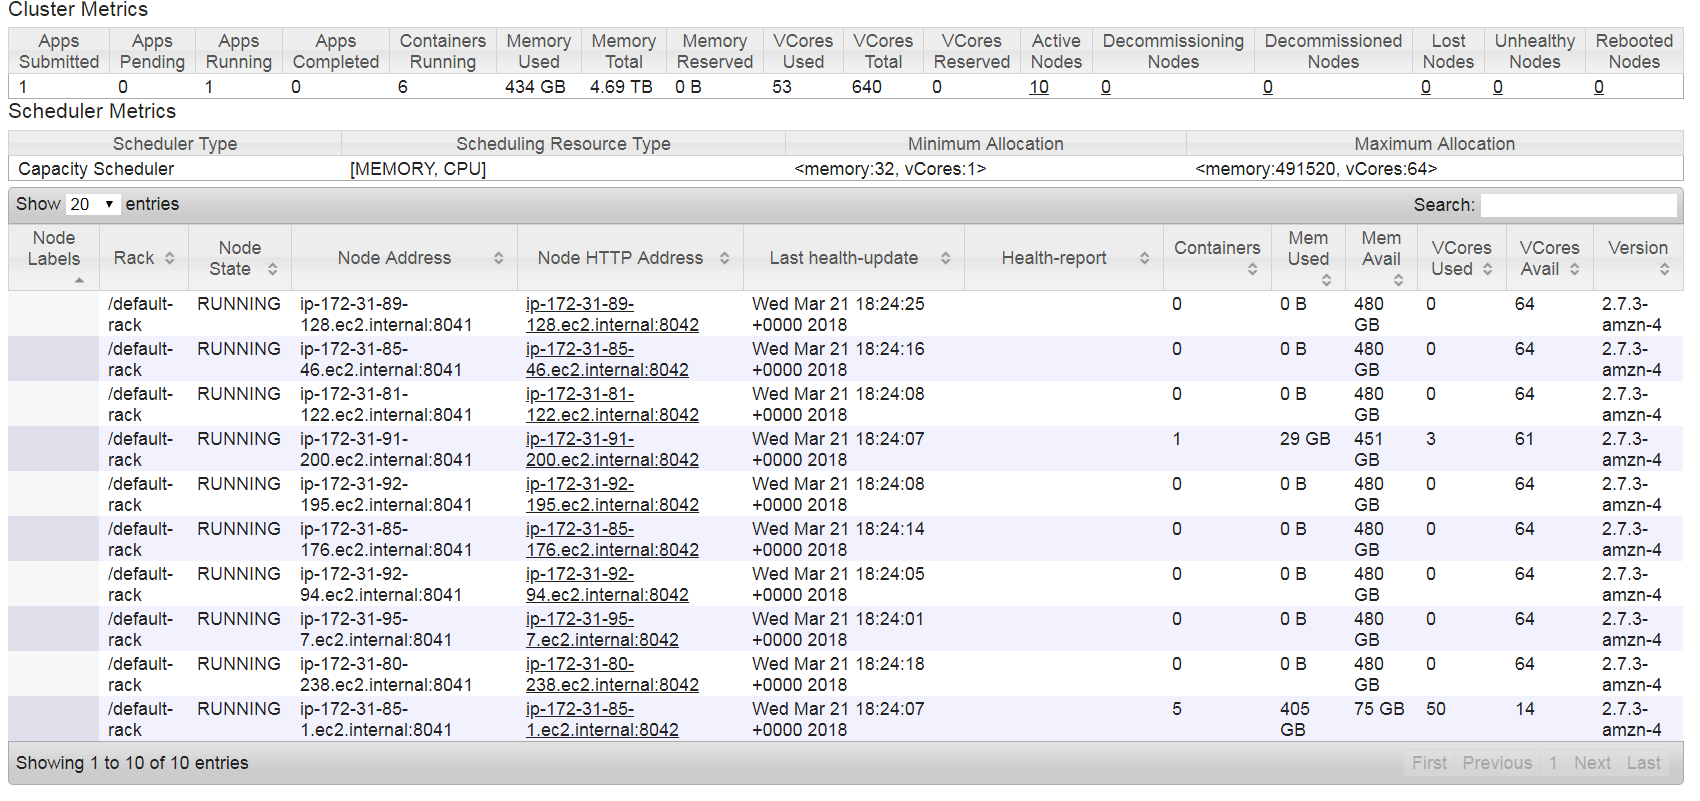
Below is nodes health status .t this point data is getting saved into S3 no wonder why i can see only two nodes are active and all are idle . This is my nodes details .At this point Data is getting saved into S3
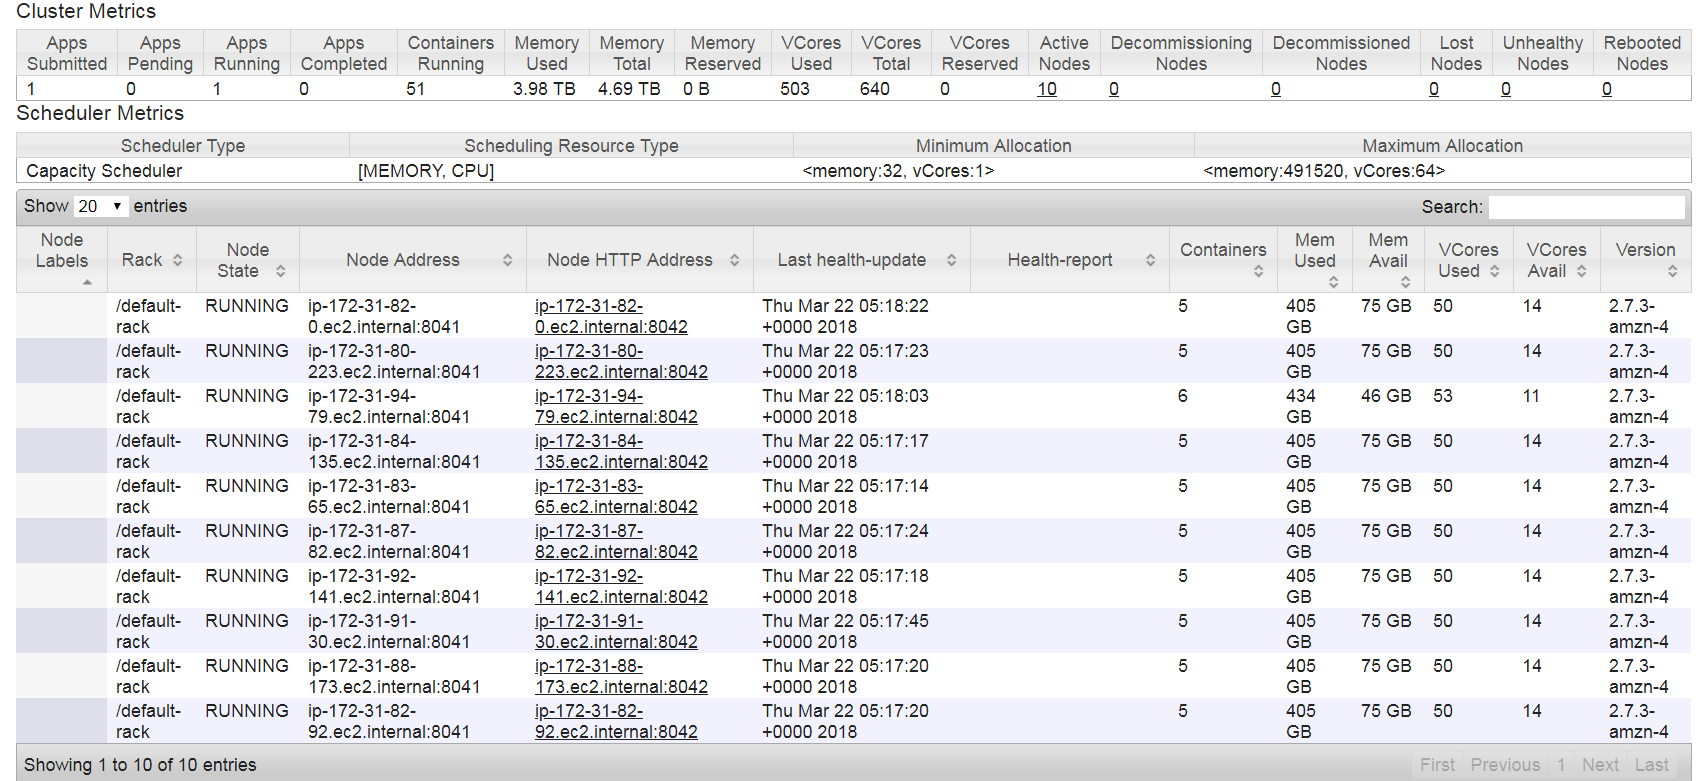
This is the cluster details when it is loading ..At this point i can see cluster is fully utilized but while saving data into S3 many nodes are free . Fully Utilized clsuter
Finally here is my code where i perform Join and then save into S3...

import org.apache.spark.sql.expressions._

          val windowSpec = Window.partitionBy("uniqueFundamentalSet", "PeriodId", "SourceId", "StatementTypeCode", "StatementCurrencyId", "FinancialStatementLineItem_lineItemId").orderBy(unix_timestamp($"TimeStamp", "yyyy-MM-dd HH:mm:ss.SSS").cast("timestamp").desc)
          val latestForEachKey = df2resultTimestamp.withColumn("rank", row_number.over(windowSpec)).filter($"rank" === 1).drop("rank", "TimeStamp")

          val columnMap = latestForEachKey.columns.filter(c => c.endsWith("_1") & c != "FFAction|!|_1").map(c => c -> c.dropRight(2)) :+ ("FFAction|!|_1", "FFAction|!|")
          val exprs = columnMap.map(t => coalesce(col(s"${t._1}"), col(s"${t._2}")).as(s"${t._2}"))
          val exprsExtended = Array(col("uniqueFundamentalSet"), col("PeriodId"), col("SourceId"), col("StatementTypeCode"), col("StatementCurrencyId"), col("FinancialStatementLineItem_lineItemId")) ++ exprs

          //Joining both dara frame here
          val dfMainOutput = (dataMain.join(latestForEachKey, Seq("uniqueFundamentalSet", "PeriodId", "SourceId", "StatementTypeCode", "StatementCurrencyId", "FinancialStatementLineItem_lineItemId"), "outer") select (exprsExtended: _*)).filter(!$"FFAction|!|".contains("D|!|"))
          //Joing ends here

          val dfMainOutputFinal = dfMainOutput.na.fill("").select($"DataPartition", $"PartitionYear", $"PartitionStatement", concat_ws("|^|", dfMainOutput.schema.fieldNames.filter(_ != "DataPartition").filter(_ != "PartitionYear").filter(_ != "PartitionStatement").map(c => col(c)): _*).as("concatenated"))

          val headerColumn = dataHeader.columns.toSeq

          val headerFinal = headerColumn.mkString("", "|^|", "|!|").dropRight(3)

          val dfMainOutputFinalWithoutNull = dfMainOutputFinal.withColumn("concatenated", regexp_replace(col("concatenated"), "|^|null", "")).withColumnRenamed("concatenated", headerFinal)

          //  dfMainOutputFinalWithoutNull.repartition($"DataPartition", $"PartitionYear", $"PartitionStatement")
  .write
  .partitionBy("DataPartition", "PartitionYear", "PartitionStatement")
  .format("csv")
  .option("timestampFormat", "yyyy/MM/dd HH:mm:ss ZZ")
  .option("nullValue", "")
  .option("delimiter", "\t")
  .option("quote", "\u0000")
  .option("header", "true")
  .option("codec", "bzip2")
  .save(outputFileURL)
Joung answered 15/10, 2017 at 11:16 Comment(8)
Show the logical plans from web UI. Do screenshots to give me/people some idea of what the code's doing. Thanks.Lactam
I've asked about physical plans for the queries from Spark's web UI. That should help me to know what exactly your queries are doing.Lactam
@JacekLaskowski Oh alright ..Can i see those in Gangelia ?Joung
Don't think so. Never used Ganglia (and my understanding is that it won't give you the plans).Lactam
@JacekLaskowski i have added all SQL plan and details ..Can you please have a look onceJoung
Are you using an S3 VPC endpoint?Peachey
@Peachey yes I am using S3 not sure about VPC...Joung
You can expose S3 as an internal VPC endpoint. This will probably give you marginally better performance.Peachey
R
3

You are running five c3.4large EC2 instances, which has 30gb of RAM each. So thats only 150GB in total which is much smaller than your >200GB dataframe to be joined. Hence lots of disk spill. Maybe you can launch r type EC2 instances (memory optimized opposed to c type which is computation optimized) instead, and see if there is a performance improvement.

Rotund answered 25/10, 2017 at 0:26 Comment(3)
Even if i use r4.4xlarge then also it takes almost same amount of time ...V core used is still 1Joung
@SUDARSHAN add this property to your cluster config [{"classification":"spark","properties":{"maximizeResourceAllocation":"true"}}]Lorri
you have lots of data shuffling. maybe when you initially write the raw data, write them in the same way you would repartition in your code @SUDARSHANLorri
G
3

S3 is an object store and not a file system, hence the issues arising out of eventual consistency, non-atomic rename operations i.e., every time the executors writes the result of the job, each of them write to a temporary directory outside the main directory (on S3) where the files had to be written and once all the executors are done a rename is done to get atomic exclusivity. This is all fine in a standard filesystem like hdfs where renames are instantaneous but on an object store like S3, this is not conducive as renames on S3 are done at 6MB/s.

To overcome above problem, ensure setting the following two conf parameters

1) spark.hadoop.mapreduce.fileoutputcommitter.algorithm.version=2

For default value of this parameter i.e. 1, commitTask moves data generated by a task from the task temporary directory to job temporary directory and when all tasks complete, commitJob moves data to from job temporary directory the final destination. Because the driver is doing the work of commitJob, for S3, this operation can take a long time. A user may often think that his/her cell is “hanging”. However, when the value of mapreduce.fileoutputcommitter.algorithm.version is 2, commitTask will move data generated by a task directly to the final destination and commitJob is basically a no-op.

2) spark.speculation=false

In case this parameter is set to true then if one or more tasks are running slowly in a stage, they will be re-launched. As mentioned in above the write operation on S3 through spark job is very slow and hence we can see a lot of tasks getting re-launched as the output data size increases.

This along with eventual consistency (while moving files from temporary directory to main data directory) may cause FileOutputCommitter to go into dead lock and hence the job could fail.

Alternatively

You can write the output first to the local HDFS on EMR and then move the data to S3 using the hadoop distcp command. This improves the overall output speed drastically. However, you will need enough EBS storage on your EMR nodes to ensure all your output data fits in.

Further, you can write the output data in ORC format which will compress the output size considerably.

Reference :

https://medium.com/@subhojit20_27731/apache-spark-and-amazon-s3-gotchas-and-best-practices-a767242f3d98

Gandzha answered 1/4, 2018 at 10:20 Comment(3)
Harsh, this is just a cut and paste with a few changes of Subhojit Banerjee's 2016 paper, words like "performant" give it away. Please do your own research when composing an answer. medium.com/@subhojit20_27731/… .Smaragdite
@SteveLoughran thanks for sharing the link. Its just that I ran into similar performance issues and I had copied explanations from multiple articles and formed a conclusion and learnings for myself. The above mentioned solutions resolved my issues. I agree that some of the points are from the article you mentioned but not everything and I don't have URL's for all of them. :-)Gandzha
Well, I think you should give him credit. That entire first para and the discussion about 6MB/s is from him.Smaragdite

© 2022 - 2024 — McMap. All rights reserved.