I learned this technique from Jason Brownlee, PhD and author of more than 18 books having to do with Applied Machine Learning, Mathematics, and Statistics:
To give proper credit where is due, I am citing my source of the learning I achieved through this material:
Citing reference Book:
Introduction to Time Series Forecasting with Python © Copyright 2020 Jason Brownlee. All Rights Reserved. Edition: v1.10
Jason Brownlee, PhD, Machine Learning Mastery
https://machinelearningmastery.com/develop-arch-and-garch-models-for-time-series-forecasting-in-python/
Thank you Jason for the countless hours and no doubt headaches and eye strain. You taught me that machine learning can be fun!
ARCH and GARCH Models in Python
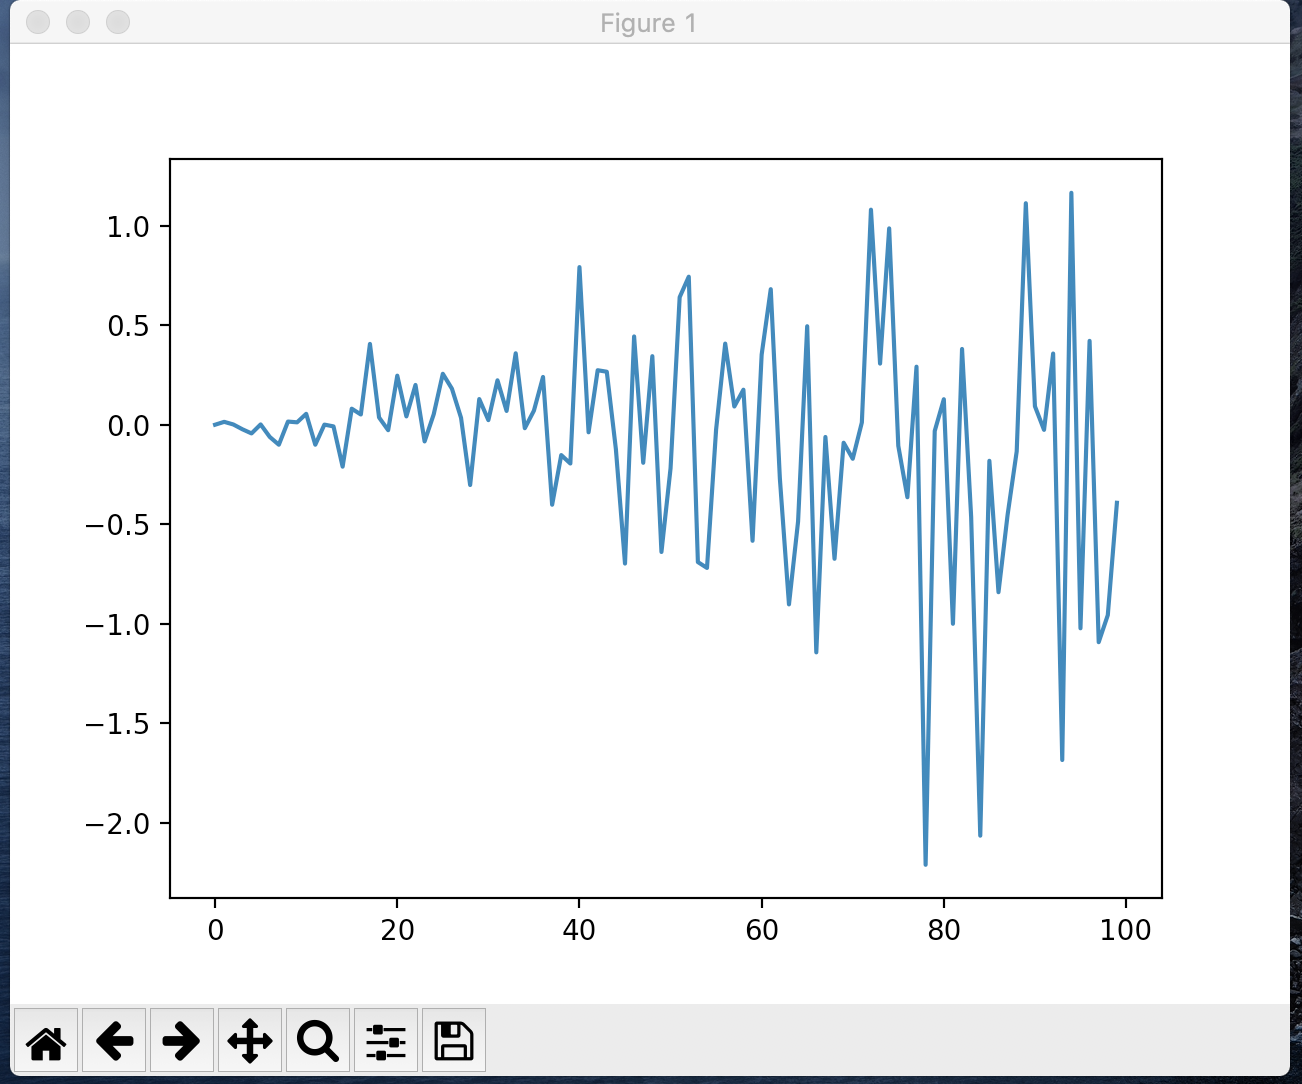
# create a simple white noise with increasing variance
from random import gauss
from random import seed
from matplotlib import pyplot

# seed pseudorandom number generator
seed(1)

# create dataset
data = [gauss(0, i*0.01) for i in range(0,100)]

# plot
pyplot.plot(data)
pyplot.show()
![enter image description here]()
# create dataset
data = [gauss(0, i*0.01) for i in range(1,100+1)]

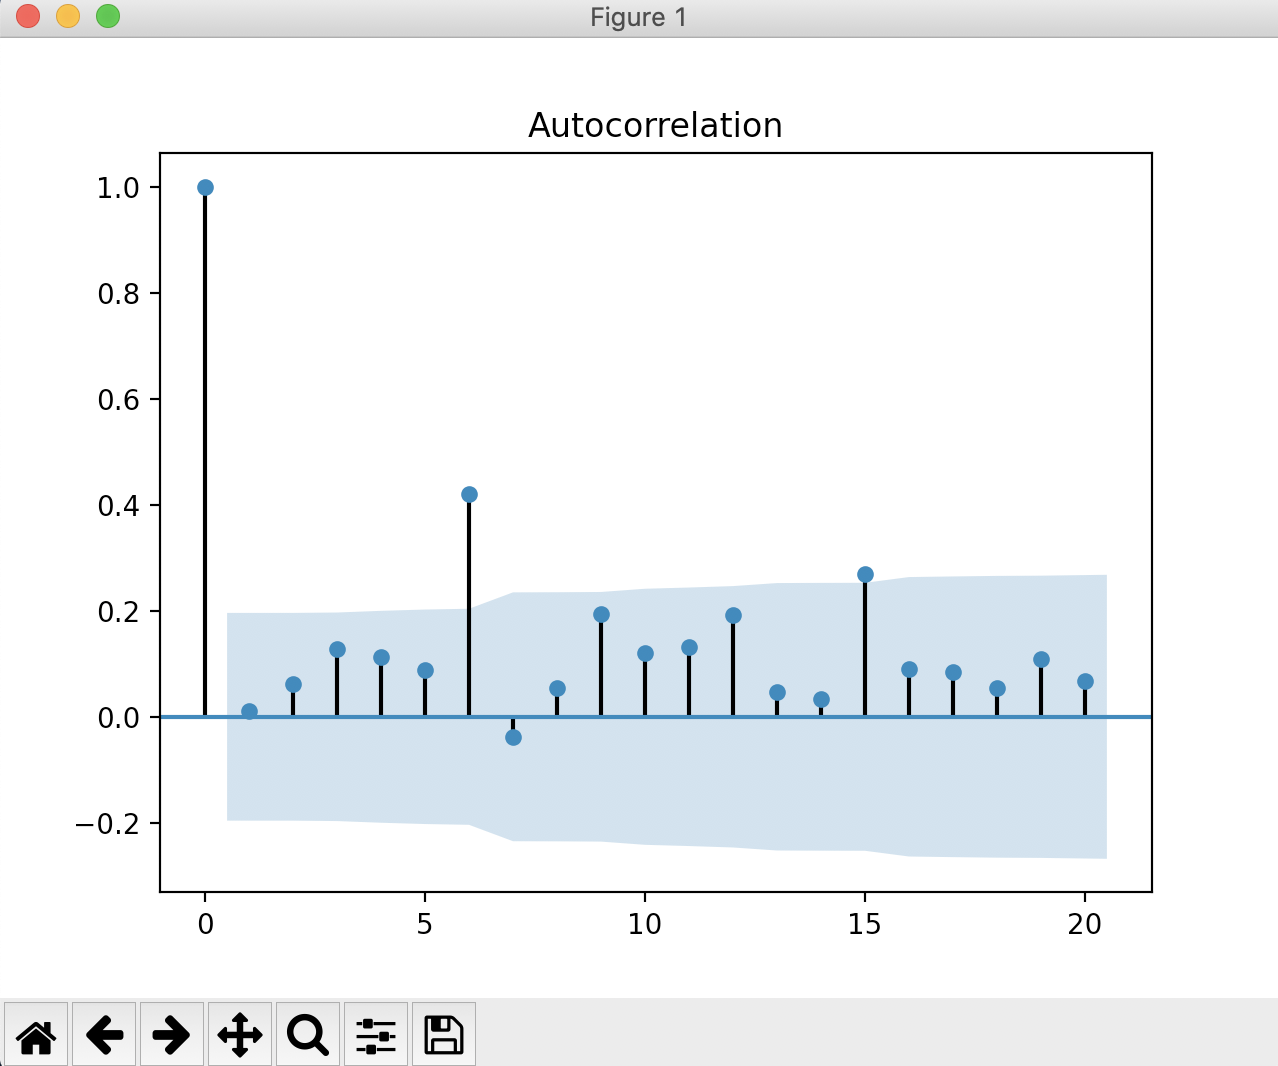
# check correlations of squared observations
from random import gauss
from random import seed
from matplotlib import pyplot
from statsmodels.graphics.tsaplots import plot_acf

# seed pseudorandom number generator
seed(1)

# create dataset
data = [gauss(0, i*0.01) for i in range(0,100)]

# square the dataset
squared_data = [x**2 for x in data]

# create acf plot
plot_acf(np.array(squared_data))
pyplot.show()
![enter image description here]()
# split into train/test
n_test = 10
train, test = data[:-n_test], data[-n_test:]

# example of ARCH model
from random import gauss
from random import seed
from matplotlib import pyplot
from arch import arch_model

# seed pseudorandom number generator
seed(1)

# create dataset
data = [gauss(0, i*0.01) for i in range(0,100)]

# split into train/test
n_test = 10
train, test = data[:-n_test], data[-n_test:]

# define model
model = arch_model(train, mean='Zero', vol='ARCH', p=15)

# fit model
model_fit = model.fit()

# forecast the test set
yhat = model_fit.forecast(horizon=n_test)

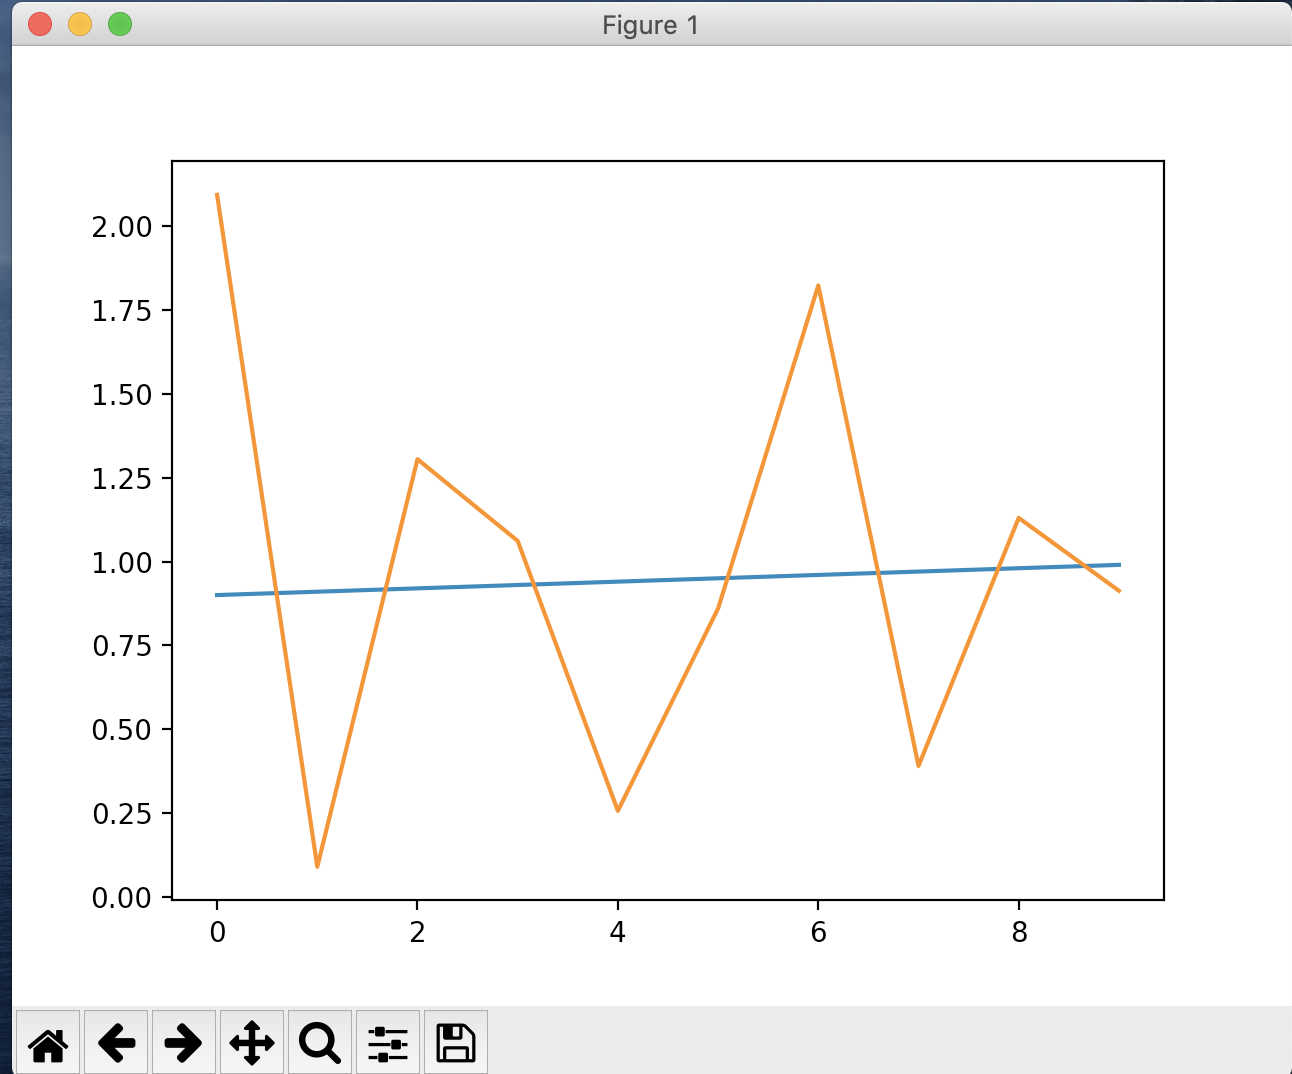
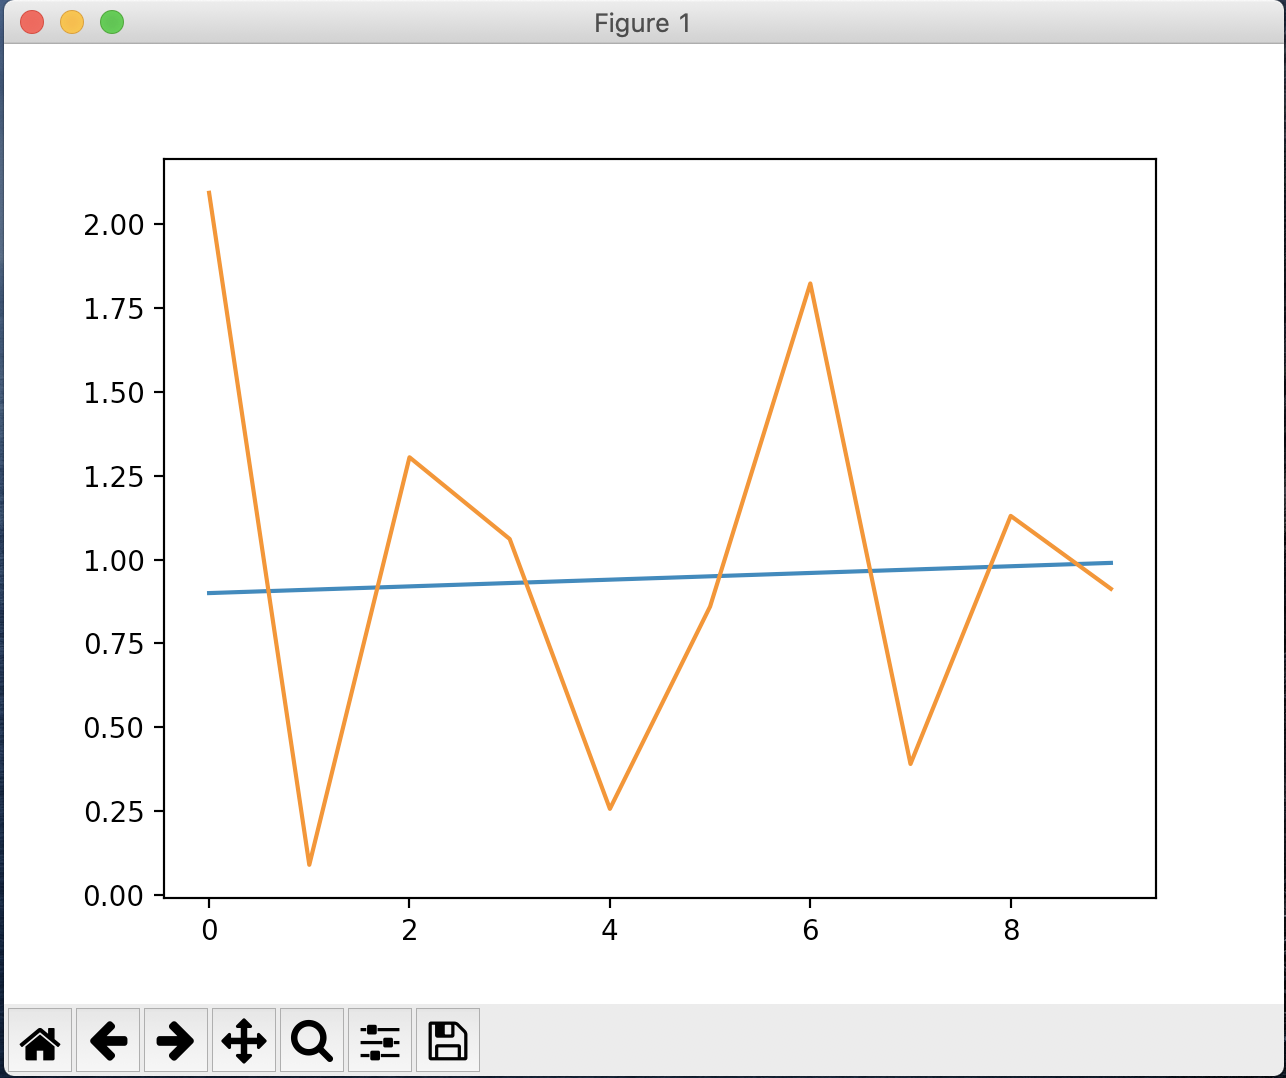
# plot the actual variance
var = [i*0.01 for i in range(0,100)]
pyplot.plot(var[-n_test:])

# plot forecast variance
pyplot.plot(yhat.variance.values[-1, :])
pyplot.show()
![enter image description here]()
![enter image description here]()
# example of ARCH model
# seed pseudorandom number generator
seed(1)

# create dataset
data = [gauss(0, i*0.01) for i in range(0,100)]

# split into train/test
n_test = 10
train, test = data[:-n_test], data[-n_test:]

# define model
model = arch_model(train, mean='Zero', vol='GARCH', p=15, q=15)

# fit model
model_fit = model.fit()

# forecast the test set
yhat = model_fit.forecast(horizon=n_test)

# plot the actual variance
var = [i*0.01 for i in range(0,100)]
pyplot.plot(var[-n_test:])

# plot forecast variance
pyplot.plot(yhat.variance.values[-1, :])
pyplot.show()

# define model
model = arch_model(train, mean='Zero', vol='GARCH', p=15, q=15)
![enter image description here]()
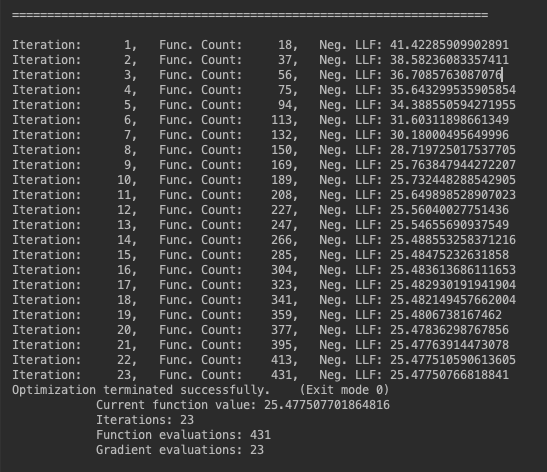
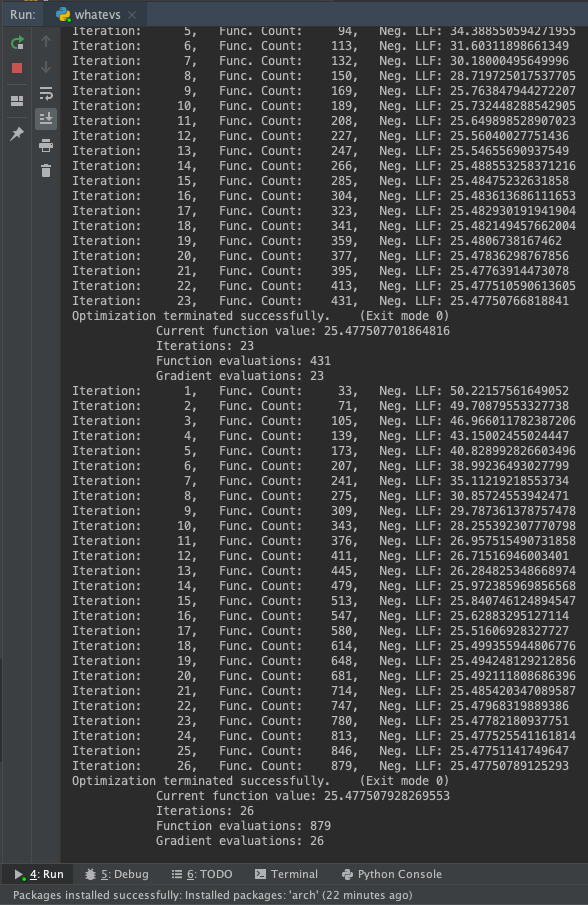
and see results are extremely similar, however with a little more than twice as many iterations...
![enter image description here]()
Citing reference Book:
Introduction to Time Series Forecasting with Python
© Copyright 2020 Jason Brownlee. All Rights Reserved. Edition: v1.10
Jason Brownlee, PhD, Machine Learning Mastery
https://machinelearningmastery.com/develop-arch-and-garch-models-for-time-series-forecasting-in-python/

