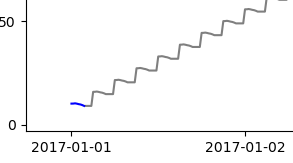
I am trying to plot my actual time series values and predicted values but it gives me this error:
ValueError: view limit minimum -36816.95989583333 is less than 1 and is an invalid Matplotlib date value. This often happens if you pass a non-datetime value to an axis that has datetime units
I am using statsmodels to fit an arima model to the data.
This is a sample of my data:
datetime             value
2017-01-01 00:00:00  10.18
2017-01-01 00:15:00  10.2
2017-01-01 00:30:00  10.32
2017-01-01 00:45:00  10.16
2017-01-01 01:00:00  9.93
2017-01-01 01:15:00  9.77
2017-01-01 01:30:00  9.47
2017-01-01 01:45:00  9.08
This is my code:
mod = sm.tsa.statespace.SARIMAX(
    subset,
    order=(1, 1, 1),
    seasonal_order=(1, 1, 1, 12),
    enforce_stationarity=False,
    enforce_invertibility=False
)

results = mod.fit()
pred_uc = results.get_forecast(steps=500)
pred_ci = pred_uc.conf_int(alpha = 0.05)

# Plot
fig = plt.figure(figsize=(12, 8))
ax = fig.add_subplot(1, 1, 1)
ax.plot(subset,color = "blue")
ax.plot(pred_uc.predicted_mean, color="black", alpha=0.5, label='SARIMAX')
plt.show()
Any idea how to fix this?


subset? – Dartdf = pd.read_csv('interpolated-detailed.csv') df.set_index('datetime') subset = df[(df['datetime'] > "2017-01-04") & (df['datetime'] < "2017-01-05")] subset = subset.iloc[:, 0:2]@Dart – Vergarasm.tsa.statespace.SARIMAXdoesn't like mysubsetfor some reason:ValueError: Pandas data cast to numpy dtype of object. Check input data with np.asarray(data).Converting withpd.to_datetimedidn't help – Dartsubset.set_index(subset["datetime"])before callingsm.tsa.statespace.SARIMAX– Vergarasubset = subset.set_index("datetime")@Dart – Vergarasubsetandpred_uc.predicted_meanbefore plotting to check if the format of datetimes is the same? – Dartpd.to_datetime. My next guess was to use this answer: https://mcmap.net/q/910069/-add-date-tickers-to-a-matplotlib-python-chart – Lattermost