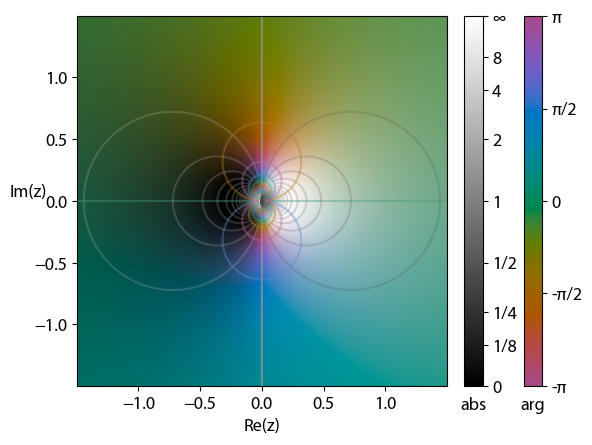
I have a 2d map of a coordinate transform. The data at each point is the aximuthal angle in the original coordinate system, which goes from 0 to 360. I'm trying to use pyplot.contour to plot lines of constant angle, e.g. 45 degrees. The contour appears along the 45 degree line between the two poles, but there's an additional part to the contour that connects the two poles along the 0/360 discontinuity. This makes a very jagged ugly line as it basically just traces the pixels with a number close to 0 on one side and another close to 360 on the other.
Examples:
Here is an image using full colour map:

You can see the discontinuity along the blue/red curve on the left side. One side is 360 degrees, the other is 0 degrees. When plotting contours, I get:

Note that all contours connect the two poles, but even though I have NOT plotted the 0 degree contour, all the other contours follow along the 0 degree discontinuity (because pyplot thinks if it's 0 on one side and 360 on the other, there must be all other angles in between).
Code to produce this data:
import numpy as np
import matplotlib.pyplot as plt

jgal = np.array(
    [
        [-0.054875539726, -0.873437108010, -0.483834985808],
        [0.494109453312, -0.444829589425, 0.746982251810],
        [-0.867666135858, -0.198076386122, 0.455983795705],
    ]
)


def s2v3(rra, rdec, r):
    pos0 = r * np.cos(rra) * np.cos(rdec)
    pos1 = r * np.sin(rra) * np.cos(rdec)
    pos2 = r * np.sin(rdec)
    return np.array([pos0, pos1, pos2])


def v2s3(pos):
    x = pos[0]
    y = pos[1]
    z = pos[2]
    if np.isscalar(x):
        x, y, z = np.array([x]), np.array([y]), np.array([z])
    rra = np.arctan2(y, x)
    low = np.where(rra < 0.0)
    high = np.where(rra > 2.0 * np.pi)
    if len(low[0]):
        rra[low] = rra[low] + (2.0 * np.pi)
    if len(high[0]):
        rra[high] = rra[high] - (2.0 * np.pi)
    rxy = np.sqrt(x ** 2 + y ** 2)
    rdec = np.arctan2(z, rxy)
    r = np.sqrt(x ** 2 + y ** 2 + z ** 2)
    if x.size == 1:
        rra = rra[0]
        rdec = rdec[0]
        r = r[0]
    return rra, rdec, r


def gal2fk5(gl, gb):
    rgl = np.deg2rad(gl)
    rgb = np.deg2rad(gb)
    r = 1.0
    pos = s2v3(rgl, rgb, r)

    pos1 = np.dot(pos.transpose(), jgal).transpose()

    rra, rdec, r = v2s3(pos1)

    dra = np.rad2deg(rra)
    ddec = np.rad2deg(rdec)

    return dra, ddec


def make_coords(resolution=50):
    width = 9
    height = 6
    px = width * resolution
    py = height * resolution
    coords = np.zeros((px, py, 4))
    for ix in range(0, px):
        for iy in range(0, py):
            l = 360.0 / px * ix - 180.0
            b = 180.0 / py * iy - 90.0
            dra, ddec = gal2fk5(l, b)
            coords[ix, iy, 0] = dra
            coords[ix, iy, 1] = ddec
            coords[ix, iy, 2] = l
            coords[ix, iy, 3] = b
    return coords


coords = make_coords()

# now do one of these
# plt.imshow(coords[:,:,0],origin='lower') # color plot
plt.contour(
    coords[:, :, 0], levels=[45, 90, 135, 180, 225, 270, 315]
)  # contour plot with jagged ugliness

plt.show()
How can I either:
stop pyplot.contour from drawing a contour along the discontinuity
make pyplot.contour recognize that the 0/360 discontinuity in angle is not a real discontinuity at all.
I can just increase the resolution of the underlying data, but before I get a nice smooth line it starts to take a very long time and a lot of memory to plot.
I will also want to plot a contour along 0 degrees, but if I can figure out how to hide the discontinuity I can just shift it to somewhere else not near a contour. Or, if I can make #2 happen, it won't be an issue.


imshowwill give you something like your top plot andstreamplotwill give you something close to your bottom plot. Which plot is closer to what you ultimately want? Could you supply a function that produces the data field so we have something to play with? – Baisden