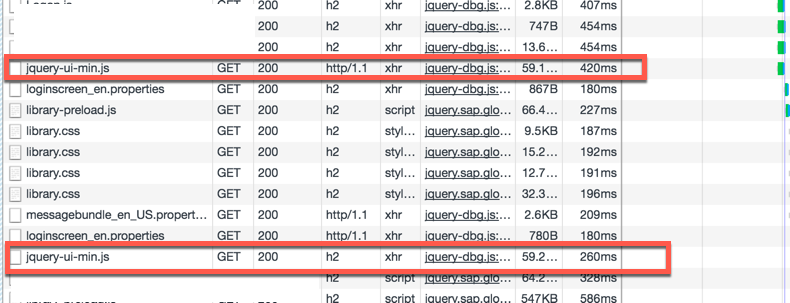
I can't explain why HTTP/1.1 is used some of the time but not the others based on the limited info you have given in your screenshots as this should not happen.
Are you 100% sure they are both to the same origin? Are the resources perhaps being served from cache and were they cached under HTTP/1.1?
On another point why are you requesting the same source twice within the same page load anyway as that seems wrong? Fair enough for data that changes (e.g. JSON requests) but don't understand why you would load jquery-UI multiple times or even the same css file as you seem to be doing? Seems a very odd use case and at least you should be caching it to use it again.
To your second question, under HTTP/2 the same connection is reused for the same origin (and this includes same effect origins in certain use cases if you have a separate vhost on the same IP address with the same https cert). This does not lead to a head of line blocking as the HTTP/2 protocol has been specifically designed for this scenario and uses multiplexing to intermingle requests.
However this does change the profile of how the requests appear in dev tools depending on the client, the server and the bandwidth. For example let's say you have a request for two resources that each take 5 seconds to download. Under HTTP/1.1 you would see:
Example
Request 1: start 0 seconds, end 5 seconds.
Request 2: start 5 seconds, end 10 seconds.
Total time to download could be calculated as: 5s + 5s = 10s
Overall Page load time would be 10 seconds
Under HTTP/2 you might see this (assuming first request was prioritised to be sent back in full first):
Example 2a
Request 1: start 0 seconds, end 5 seconds.
Request 2: start 0 seconds, end 10 seconds.
Total time **looks** be 5s + 10s = 15s
Overall Page load time would still be 10 seconds
Or alternatively it might look like this if you have enough bandwidth to handle both requests in flight at same time and if server responds with second request one second later than first:
Example 2b
Request 1: start 0 seconds, end 5 seconds.
Request 2: start 0 seconds, end 6 seconds.
Total time **looks** be 5s + 6s = 11s
Overall Page load time would be 6 seconds
The point is both "look" slower under HTTP/2 , if you try to sum the parts, even though the total time is the same under for Example 2a, and in fact 4 seconds faster for Example 2b. You cannot compare individual requests on a like for like bases in Developer tools between HTTP/1.1 and HTTP/2.
It's the same way as comparing multiple HTTP/1.1 requests (browsers typically open 4-8 connections per host rather than just one), except that there is no overhead to opening and managing multiple connections under HTTP/2 since it's baked into the protocol. And there is no 4-8 limit under HTTP/2, through browsers and servers will often implement one Apache defaults to 100 for example).
Saying all that I still think there are a lot of optimisations still to be done on both client and server to get the most out of HTTP/2. The internet has also optimised heavily for HTTP/1.1 and how it worked so some of those things may need to be undone, or at least tweaked, to make most of HTTP/2. For example a page load typically loads HTML, then CSS, then images which naturally leads to a priority. Under HTTP/2 you can request all assets at the same time but really should prioritise the CSS over the images for example. Most browsers do this, but do they do it in the most optimal way?


