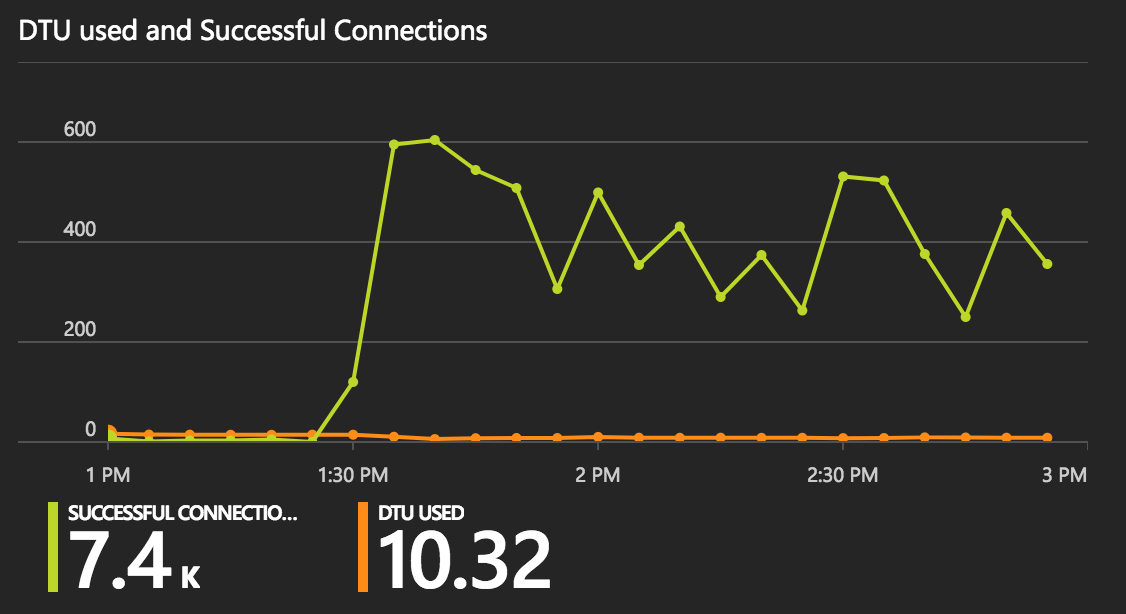
We fight the issue in production when once in a while our Azure SQL database performance significantly degrades. We know we have locks on one of the tables, but these locks are not deadlocks, they are long locks and in an hour or so the performance returns to normal. We are trying to find all the possible scenarios on how we get these long locks (every query is super fast and all performance analyzers could show us what causes long locks). The reason for this question is the picture below:
Out connection pool settings allow only 200 connections to be pooled. And most of the times we have about 10-20 open/pooled connections with the database. Then suddenly a number of active connections start to grow and the pool is completely taken. While a number of pooled connections stay below 200, we see a number of active connections using sp_who2 reach 1.5k-2k connections (sometimes 4k-5k).
I've built the same chart using Azure Portal monitoring tools. It has different aggregation period but shows the same issue:

the connection string we use:
Data Source=[server].database.windows.net;initial catalog=[database];persist security info=True;user id=[user];password=[password];MultipleActiveResultSets=True;Connection Timeout=30;Max Pool Size=200;Pooling=True;App=[AppName]
How is that possible taking into account connection pool limitation of 200 connections?
ps: there is no periodic task, long running query or other tool doing anything, we checked with sp_who2 all the active connections to the database.


usingor context must be disposed inOnDisposemethod of controller. – Addictusing(var db = new DbContext()) { ... }statement – NopeOnDisposeof controller or similar item. Is there increase in number of exceptions when number of connections increases? – Addict