If you don't want to adjust the darken parameter, and you don't want to do a deep dive into custom styles for the Google Map, you can modify the ggmap object directly.
The ggmap is essentially a character matrix, where each cell is a hex code for the color to be reproduced there. (There are some extra attributes that describe the longitude and latitude (in the EPSG:4326 coordinate reference system) of the lower left and upper right points of the ggmap, as well as the source and zoom level.)
You can use the adjustcolor() function from base R to take a color (as a hex code, an integer, or a character string-- anything that the col2rgb() function will accept) and dial up or down the red, green, blue, and alpha channels. The alpha channel controls the transparency, where 1 is fully opaque and 0 is fully transparent.
Here's a reproducible example...
First, get the meuse data, which comes with the sp package.
data(meuse)
Transform the dataframe into an sp object, assign it's proper coordinate reference system (which I found here), then transform it's coordinate reference system to longitude/latitude.
coordinates(meuse) = ~x+y
proj4string(meuse) <- "+init=epsg:28992 +proj=sterea +lat_0=52.15616055555555 +lon_0=5.38763888888889 +k=0.9999079 +x_0=155000 +y_0=463000 +ellps=bessel +towgs84=565.4171,50.3319,465.5524,-0.398957388243134,0.343987817378283,-1.87740163998045,4.0725 +units=m +no_defs"
meuse <- spTransform(meuse, CRS("+init=epsg:4326"))
Get the Google base map using the approximate center of all the points. I use the same other arguments that you do, but set the zoom much higher since these points are all quite close to each other.
meuse_basemap <- get_map(location = colMeans(coordinates(meuse)),
                         maptype = "terrain",
                         source = "google",
                         zoom = 13,
                         language = "de-DE",
                         color = "bw")
Here's where I modify the ggmap to make it transparent. I save the attributes as an object so that I can reassign the same attributes to the more transparent ggmap. I couldn't find a way to modify just the values of the ggmap in place without stripping the ggmap attributes (which then means the modified ggmap doesn't work with the ggmap() function).
meuse_basemap_attributes <- attributes(meuse_basemap)
Create a matrix the same dimensions as the Google basemap, but with all the color hex codes in each cell adjusted to half the transparency.
meuse_basemap_transparent <- matrix(adjustcolor(meuse_basemap,
                                                alpha.f = 0.5),
                                    nrow = nrow(meuse_basemap))
Assign the saved attributes to the modified matrix to turn it back into a usable ggmap.
attributes(meuse_basemap_transparent) <- meuse_basemap_attributes
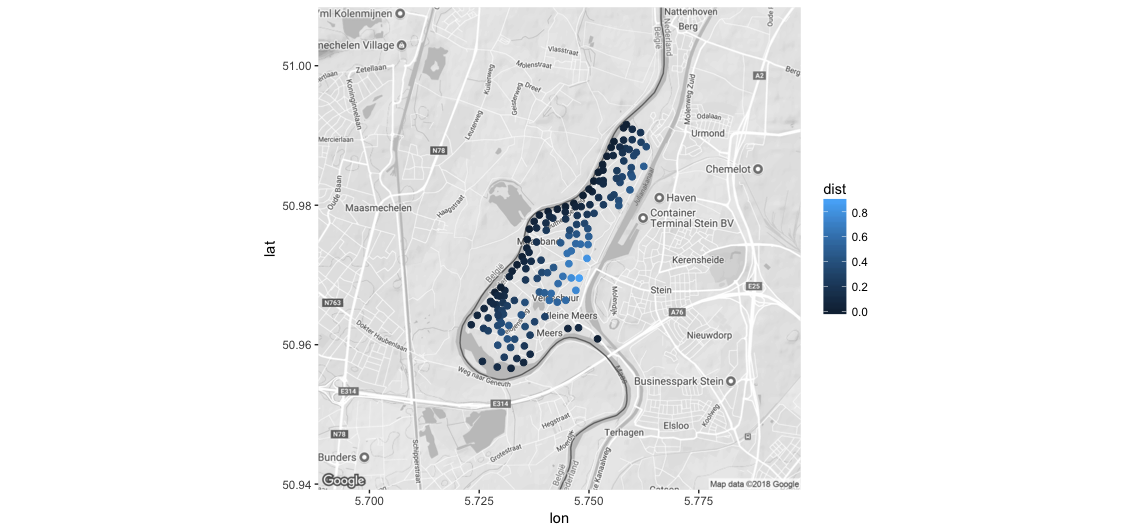
Here's the original plot:
ggmap(meuse_basemap) +
  geom_point(data = as.data.frame(meuse),
             aes(x = x, y = y, color = dist),
             cex = 2)
![original ggmap]()
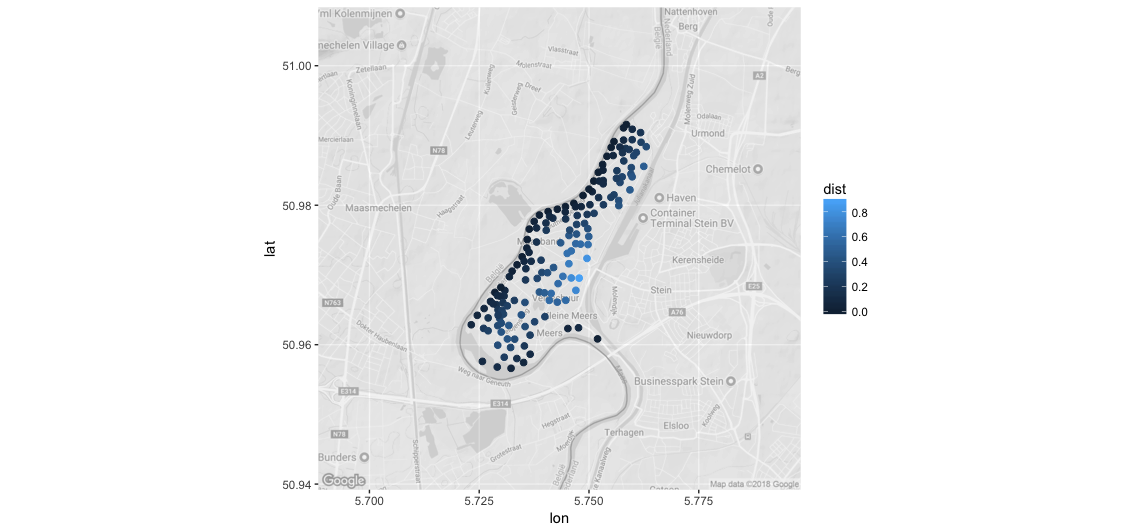
And here's the more transparent one!
ggmap(meuse_basemap_transparent) +
  geom_point(data = as.data.frame(meuse),
             aes(x = x, y = y, color = dist),
             cex = 2)
![more transparent ggmap]()


ggmap(get_googlemap("chicago", style=style_string))see?get_googlemapfor docs – Lindell