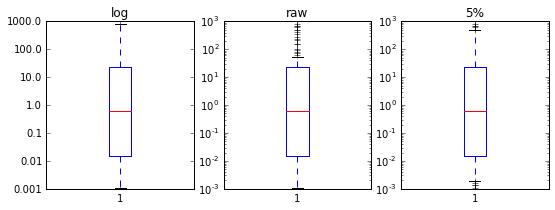
I think this is a simple question, but I just still can't seem to think of a simple solution. I have a set of data of molecular abundances, with values ranging many orders of magnitude. I want to represent these abundances with boxplots (box-and-whiskers plots), and I want the boxes to be calculated on log scale because of the wide range of values.
I know I can just calculate the log10 of the data and send it to matplotlib's boxplot, but this does not retain the logarithmic scale in plots later.
So my question is basically this: When I have calculated a boxplot based on the log10 of my values, how do I convert the plot afterward to be shown on a logarithmic scale instead of linear with the log10 values? I can change tick labels to partly fix this, but I have no clue how I get logarithmic scales back to the plot.
Or is there another more direct way to plotting this. A different package maybe that has this options already included?
Many thanks for the help.


10**y) and set the y-scale to be logarithmic? – Orsolabp = ax.boxplot(np.log10(abunds)). This command calculate the box values and creates the plot. I will need to change things in the plot, not the values, right? – Counterspybp = ax.boxplot(abunds); ax.set_yscale('log'). That will give you a log-scale, and thus the y-ticks properly correspond to your values. – Orsolaax.set_yscale('log')– Counterspyabundsvalues should not be. Are you sure you did exactly what @Evert suggested? – Inheritableax.boxplot(np.log10(abunds)). However, I don't think it will in this case calculate the box plots based on a logarithmic scale. There is too much spread in the plots and causing a lot of outliers – Counterspy