Grafana: Add annotation on multiple panels at once
Asked Answered
S

2

13

I would like to add an annotation on all panels (graphs) in the Grafana dashboard. I could add annotations manually one-by-one on all panels -- but I hope there is a better way how to do it although I didn't find any information in the official documentation.

I suppose I can write a script using Grafana API to create annotation on all panels in dashboard; however this seems like a complicated workaround more than an actual solution.

Do you know how to easily add annotations on all graphs at once?

Stroganoff answered 17/6, 2020 at 6:46 Comment(0)
C
6
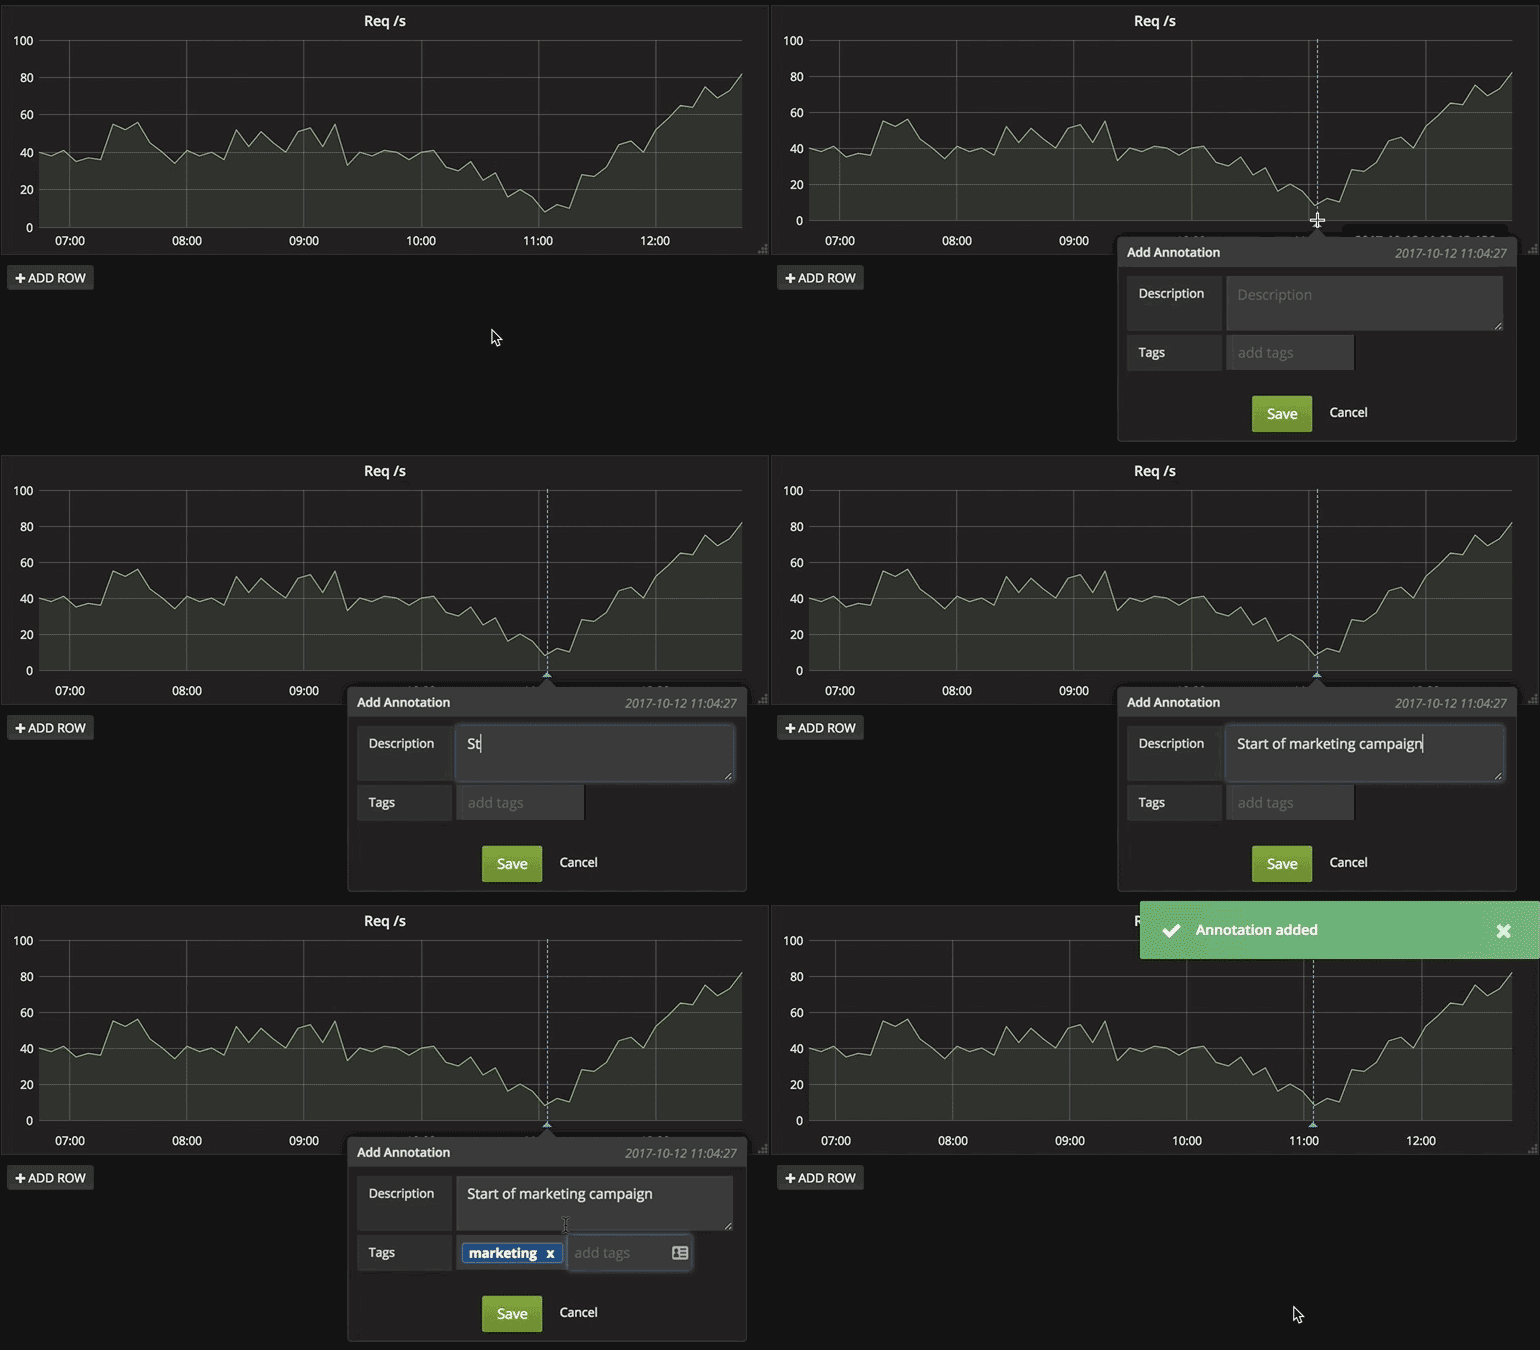
  1. add an annotation to a single graph manually, as documented in the grafana docs: https://grafana.com/docs/grafana/latest/dashboards/annotations/#adding-annotations. Make sure to give the annotation a "Tag".enter image description here

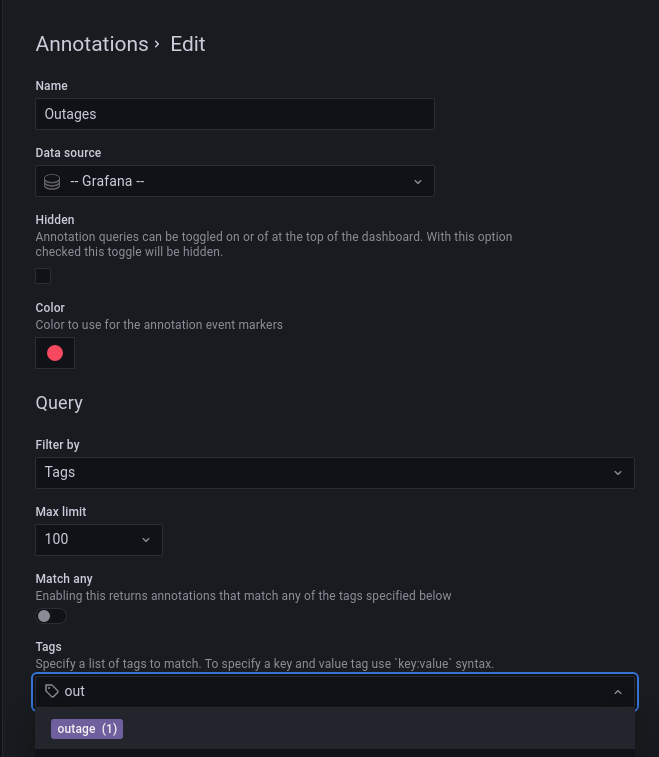
  2. Go to Dashboard Settings (gear icon at the top) > Annotations > New Query. Set the Data Source to: "-- Grafana --". Set Filter By to: "Tags". Enter the tag you used in step 1. Save your changes and you're done.

enter image description here

More details in the official grafana docs: https://grafana.com/docs/grafana/latest/dashboards/annotations/#query-by-tag

Carrageen answered 9/6, 2022 at 20:0 Comment(0)
D
9

I struggled with the same, but found the answer here: https://mcmap.net/q/863756/-tracking-events-with-prometheus-and-grafana

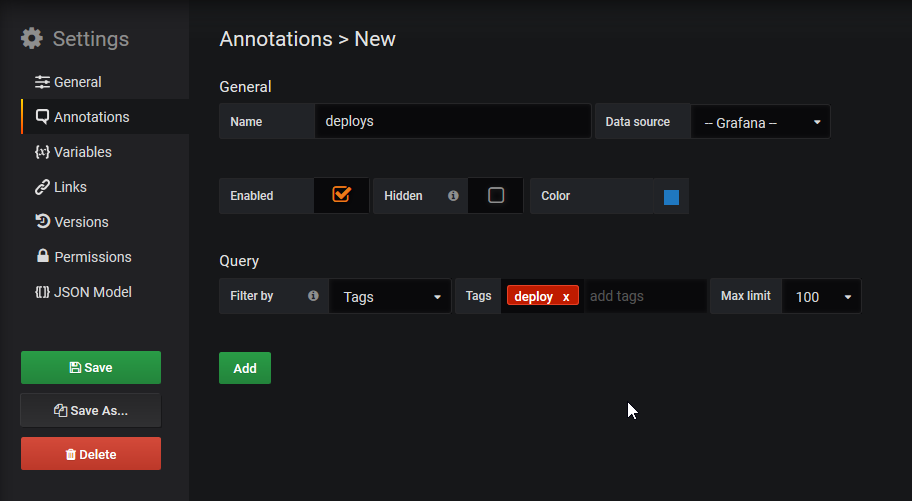
In short, you have to go to your dashboard settings, and in the "annotations" tab, create a new query... that one will automatically display the annotation in all the dashboard panels.

This is the part that worked to me from @aussiedan

Once you have your deployments being added as annotations, you can display those on your dashboard by going to the annotations tab in the dashboard settings and adding a new annotation source: adding annotation source

configuration

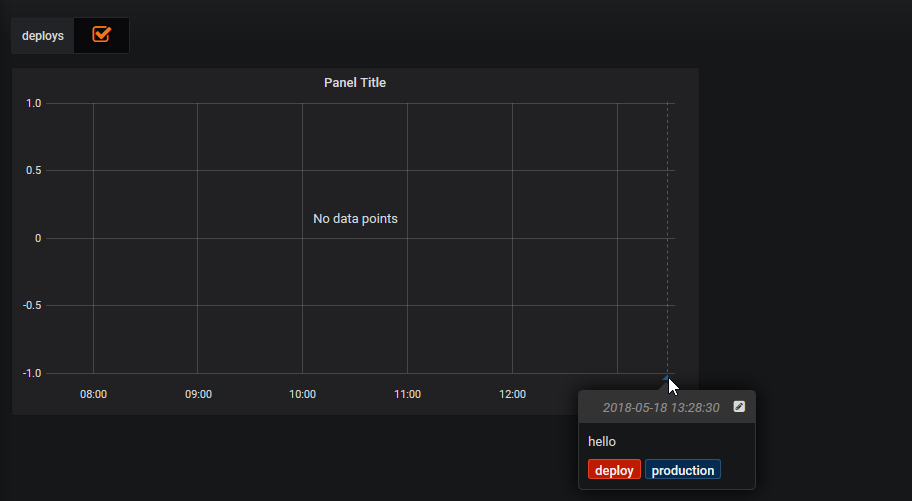
Then the annotations will be shown on the panels in your dashboard: panel showing annotation

result

Distinguish answered 3/3, 2021 at 23:46 Comment(1)
This kinda works, but you still have to use Grafana API, and my use case is a little different: I need to add an annotation in history, when unusual peek in graph occurs. Then it's pretty handy to do that for all graphs. Nevertheless, thank you!Stroganoff
C
6
  1. add an annotation to a single graph manually, as documented in the grafana docs: https://grafana.com/docs/grafana/latest/dashboards/annotations/#adding-annotations. Make sure to give the annotation a "Tag".enter image description here

  2. Go to Dashboard Settings (gear icon at the top) > Annotations > New Query. Set the Data Source to: "-- Grafana --". Set Filter By to: "Tags". Enter the tag you used in step 1. Save your changes and you're done.

enter image description here

More details in the official grafana docs: https://grafana.com/docs/grafana/latest/dashboards/annotations/#query-by-tag

Carrageen answered 9/6, 2022 at 20:0 Comment(0)

© 2022 - 2024 — McMap. All rights reserved.