How do you position the title and legend in tmap?
Asked Answered
P

1

13

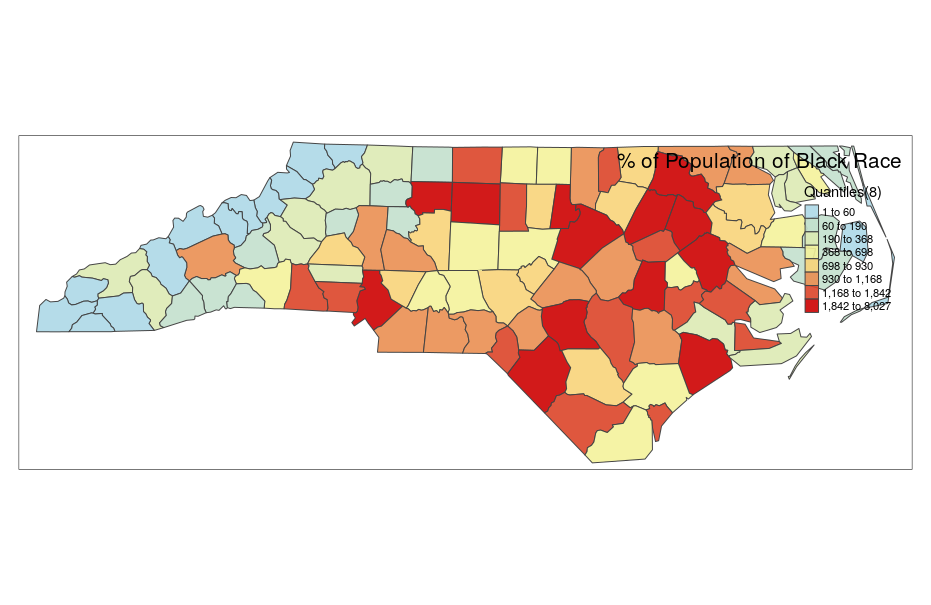
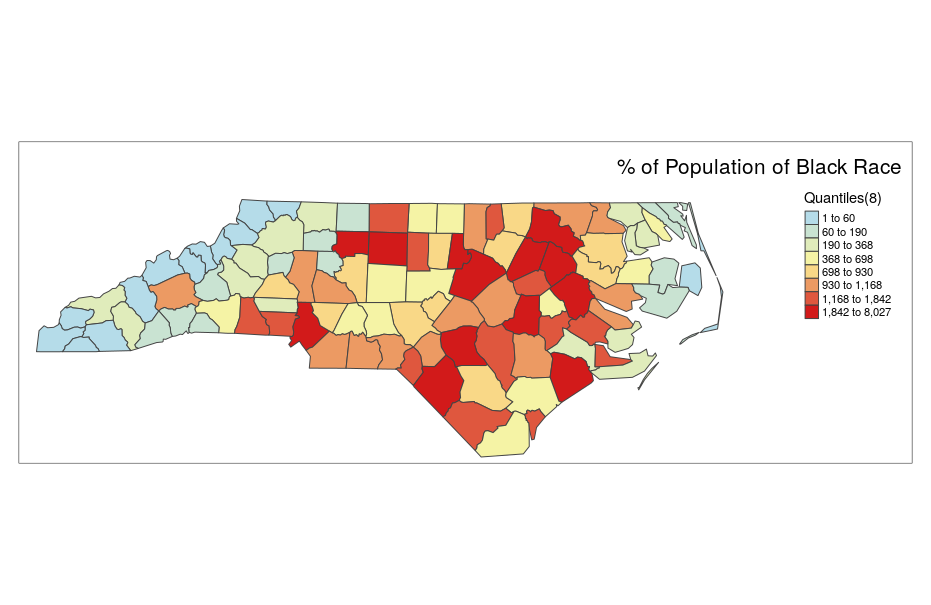
I am new to programming and am currently enrolled in an introductory spatial analysis course which uses R. The following code yields the tmaps included below. How can I center the title for each tmap as well as position the legend on the top right without laying over top the maps themselves?

Thank you very much for your assistance.

  ga1 = tm_shape(a2georgia) +
  tm_polygons('PctBlack', style='quantile', breaks=c(4.98,11.75, 22.35,27.64, 32.55, 40.06,   48.18, 79.64),
              n=8, palette=c('lightblue','khaki1', 'red3'), title='Quantiles(8)',
              border.col='grey27', alpha=.9) +
  tm_layout(legend.position = c("right", "top"), title= '% of Population of Black Race', title.position = c('right', 'top'))


ga_cartogram <- cartogram_cont(a2georgia, "PctBlack", itermax=5)

  ga2 = tm_shape(ga_cartogram) + 
  tm_polygons("PctBlack", style='quantile', breaks=c(4.98,11.75, 22.35,27.64, 32.55, 40.06, 48.18, 79.64), 
              n=8, palette=c('lightblue','khaki1', 'red3'), title='Quantiles(8)',
              border.col='grey27', alpha=.9) +
  tm_layout(legend.position = c("right", "top"), title= '% of Population of Black Race',  title.position = c('right', 'top'))


tmap_arrange(ga1,ga2)

Tmaps

Palomino answered 27/3, 2020 at 18:26 Comment(2)
The documentation appears to have main.title.position with possible value center. Have you looked into that?Ibo
Just tried that and the legend becomes positioned higher up but still slightly overtop the map. The main title was not affected.Palomino
B
18

The problem is that {tmap} draws legend and titles inside the bounding box of your polygon. To make more room you have to extend the bounding box somewhat.

A while back I wrote a blog post on this topic, you might want to have a look at that https://www.jla-data.net/eng/adjusting-bounding-box-of-a-tmap-map/

As your example is not exactly reproducible I will demonstrate the technique on the North Carolina shapefile that is shipped with {sf} and thus widely available.

library(sf)
library(tmap)

# NC counties - a shapefile shipped with the sf package
nc <- st_read(system.file("shape/nc.shp", package ="sf"))


# bad, bad map...
tm_shape(nc) + tm_polygons("NWBIR74", style='quantile', 
                           breaks=c(4.98,11.75, 22.35,27.64, 32.55, 40.06, 48.18, 79.64),
                           n=8, palette=c('lightblue','khaki1', 'red3'), 
                           title='Quantiles(8)',
                           border.col='grey27', alpha=.9) +
  tm_layout(legend.position = c("right", "top"), 
            title= '% of Population of Black Race', 
            title.position = c('right', 'top'))

enter image description here

# make some bbox magic
bbox_new <- st_bbox(nc) # current bounding box

xrange <- bbox_new$xmax - bbox_new$xmin # range of x values
yrange <- bbox_new$ymax - bbox_new$ymin # range of y values

# bbox_new[1] <- bbox_new[1] - (0.25 * xrange) # xmin - left
 bbox_new[3] <- bbox_new[3] + (0.25 * xrange) # xmax - right
# bbox_new[2] <- bbox_new[2] - (0.25 * yrange) # ymin - bottom
bbox_new[4] <- bbox_new[4] + (0.2 * yrange) # ymax - top

bbox_new <- bbox_new %>%  # take the bounding box ...
  st_as_sfc() # ... and make it a sf polygon

# looks better, does it?
tm_shape(nc, bbox = bbox_new) + tm_polygons("NWBIR74", style='quantile', 
                           breaks=c(4.98,11.75, 22.35,27.64, 32.55, 40.06, 48.18, 79.64),
                           n=8, palette=c('lightblue','khaki1', 'red3'), 
                           title='Quantiles(8)',
                           border.col='grey27', alpha=.9) +
  tm_layout(legend.position = c("right", "top"), 
            title= '% of Population of Black Race', 
            title.position = c('right', 'top'))

enter image description here

Bobwhite answered 28/3, 2020 at 9:57 Comment(2)
Fantastic, thanks for your response. May I ask you to clarify the following? Are you saying that a sf geometry is needed?bbox_new <- bbox_new %>% # take the bounding box ... st_as_sfc() # ... and make it a sf polygonPalomino
The sf::st_as_sfc is necessary because bbox argument of tmap::tm_shape expects a geometry, while sf::st_bbox returns a vector; have a look at {sf} documentation for more detailed explanation rdocumentation.org/packages/sf/versions/0.8-1/topics/st_bboxBobwhite

© 2022 - 2024 — McMap. All rights reserved.