This is deceptively difficult. The most foolproof way of doing it is to define a new makeContent method for a segmentsGrob, which in turn means defining a new grob class, which has to be called from a new Geom class, which requires a new geom. The maths itself isn't too difficult, but there's a lot of boilerplate involved.
First, let us define the function that actually does the maths on the modified segmentsGrob, which will just be a segmentsGrob with a different S3 class name - we'll call it "roundseg":
makeContent.roundseg <- function(x) {
  x$x0 <- grid::convertX(x$x0, "cm")
  x$x1 <- grid::convertX(x$x1, "cm")
  x$y0 <- grid::convertY(x$y0, "cm")
  x$y1 <- grid::convertY(x$y1, "cm")
  xmin <- pmin(as.numeric(x$x0), as.numeric(x$x1))
  xmax <- pmax(as.numeric(x$x0), as.numeric(x$x1))
  ymin <- pmin(as.numeric(x$y0), as.numeric(x$y1))
  ymax <- pmax(as.numeric(x$y0), as.numeric(x$y1))
  theta <- atan2(ymax - ymin, xmax - xmin)
  size <- 0.5 * x$gp$lwd / .stroke
  xmin <- xmin + cos(theta) * size
  xmax <- xmax - cos(theta) * size
  ymin <- ymin + sin(theta) * size
  ymax <- ymax - sin(theta) * size
  x$x0 <- unit(xmin, "cm")
  x$x1 <- unit(xmax, "cm")
  x$y0 <- unit(ymin, "cm")
  x$y1 <- unit(ymax, "cm")
  return(x)
}
Now we define a new Geom class - we'll call it GeomRoundseg. It's almost identical to GeomSegment, except its draw_panel member is redefined to change the segmentsGrob to a different class, so that the above function is called whenever the grob is drawn or the window resized:
GeomRoundseg <- ggproto("GeomRoundseg", GeomSegment,
  draw_panel = function (self, data, panel_params, coord, arrow = NULL,
                         arrow.fill = NULL, linejoin = "round", na.rm = FALSE)
{
  data <- ggplot2:::check_linewidth(data, snake_class(self))
  data <- ggplot2:::remove_missing(data, na.rm = na.rm, c("x", "y", "xend",
                        "yend", "linetype", "linewidth", "shape"),
                        name = "geom_roundseg")
  if (ggplot2:::empty(data))
    return(zeroGrob())
  if (coord$is_linear()) {
    coord <- coord$transform(data, panel_params)
    arrow.fill <- ggplot2:::`%||%`(arrow.fill, coord$colour)
    sg <- grid::segmentsGrob(coord$x, coord$y, coord$xend, coord$yend,
              default.units = "native",
              gp = grid::gpar(col = scales::alpha(coord$colour,
              coord$alpha), fill = scales::alpha(arrow.fill, coord$alpha),
              lwd = coord$linewidth * .pt, lty = coord$linetype,
              lineend = "round", linejoin = linejoin), arrow = arrow)
    class(sg) <- c("roundseg", class(sg))
    return(sg)
  }
  data$group <- 1:nrow(data)
  starts <- subset(data, select = c(-xend, -yend))
  ends <- rename(subset(data, select = c(-x, -y)), c(xend = "x",
                                                     yend = "y"))
  pieces <- vec_rbind0(starts, ends)
  pieces <- pieces[order(pieces$group), ]
  GeomPath$draw_panel(pieces, panel_params, coord, arrow = arrow,
                      lineend = lineend)
})
Finally, we need a geom_roundseg function that is almost an exact copy of geom_segment, except its lineend parameter is removed and it uses our new Geom object:
geom_roundseg <- function (mapping = NULL, data = NULL, stat = "identity",
          position = "identity", ..., arrow = NULL, arrow.fill = NULL,
          linejoin = "round", na.rm = FALSE,
          show.legend = NA, inherit.aes = TRUE) {
  layer(data = data, mapping = mapping, stat = stat, geom = GeomRoundseg,
        position = position, show.legend = show.legend,
        inherit.aes = inherit.aes,
        params = rlang::list2(arrow = arrow, arrow.fill = arrow.fill,
                       linejoin = linejoin, na.rm = na.rm, ...))
}
Now we're done. When we call our plot, the tips of the rounded segment will be at the specified x, y co-ordinates:
df <- data.frame(x = 0, xend = 1, y = 0, yend = 0)
ggplot(df, aes(x, y)) +
  geom_vline(xintercept = c(0, 1), lty = 2) +
  geom_roundseg(aes(xend = xend, yend = yend),
               linewidth = 6, alpha = 0.5)  +
  labs(title =  "Now an accurate representation of the data",
       caption = "The line meets the given values")
![enter image description here]()
If we rescale the window, the tips stay in place:
![enter image description here]()
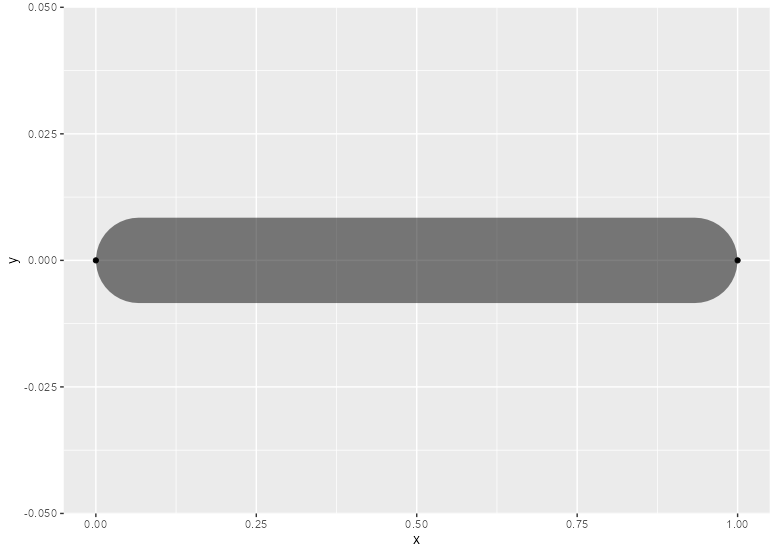
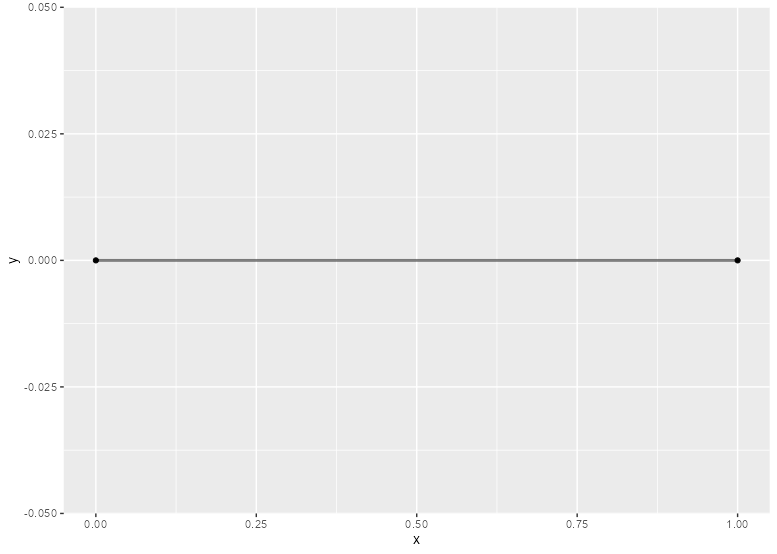
And changing the linewidth is catered for:
df <- data.frame(x = 0, xend = 1, y = 0, yend = 0)
ggplot(df, aes(x, y)) +
  geom_roundseg(aes(xend = xend, yend = yend),
               linewidth = 30, alpha = 0.5)  +
  geom_point() +
  geom_point(aes(xend, yend))
![enter image description here]()
df <- data.frame(x = 0, xend = 1, y = 0, yend = 0)
ggplot(df, aes(x, y)) +
  geom_roundseg(aes(xend = xend, yend = yend),
               linewidth = 1, alpha = 0.5)  +
  geom_point() +
  geom_point(aes(xend, yend))
![enter image description here]()
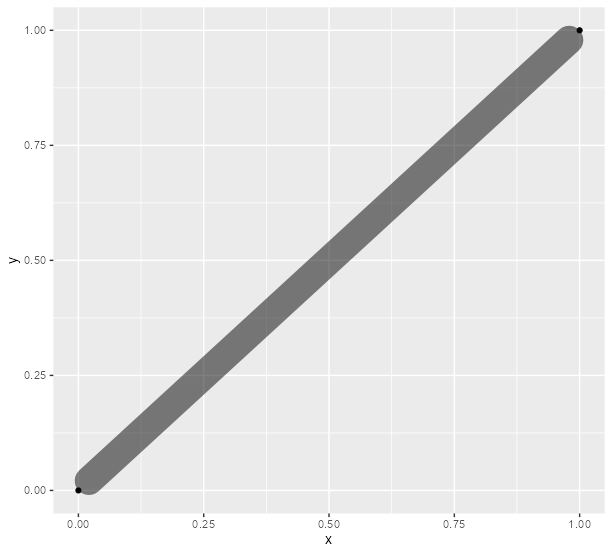
And this continues to work whatever the angle of our segment:
df <- data.frame(x = 0, xend = 1, y = 0, yend = 1)
ggplot(df, aes(x, y)) +
  geom_roundseg(aes(xend = xend, yend = yend),
               linewidth = 6, alpha = 0.5)  +
  geom_point() +
  geom_point(aes(xend, yend))
![enter image description here]()


