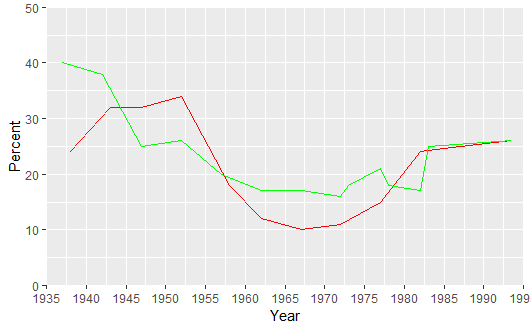
ggplot line graph with NA values
Asked Answered
M

3

13

I'm having with trouble with ggplot trying to plot 2 incomplete time series on the same graph where the y data does not have the same values on the x-axis (year) - NAs are thus present for certain years :

test<-structure(list(YEAR = c(1937, 1938, 1942, 1943, 1947, 1948, 1952, 
1953, 1957, 1958, 1962, 1963, 1967, 1968, 1972, 1973, 1977, 1978, 
1982, 1983, 1986.5, 1987, 1993.5), A1 = c(NA, 24, NA, 32, 32, 
NA, 34, NA, NA, 18, 12, NA, 10, NA, 11, NA, 15, NA, 24, NA, NA, 
25, 26), A2 = c(40, NA, 38, NA, 25, NA, 26, NA, 20, NA, 17, 
17, 17, NA, 16, 18, 21, 18, 17, 25, NA, NA, 26)), .Names = c("YEAR", "A1", 
"A2"), row.names = c(NA, -23L), class = "data.frame")

The following code I tried outputs a disjointed mess :

ggplot(test, aes(x=YEAR)) + 
  geom_line(aes(y = A1), size=0.43, colour="red") +  
  geom_line(aes(y = A2), size=0.43, colour="green") +
  xlab("Year") + ylab("Percent") +
  scale_x_continuous(limits=c(1935, 1995), breaks = seq(1935, 1995, 5),
                     expand = c(0, 0)) + 
  scale_y_continuous(limits=c(0,50), breaks=seq(0, 50, 10), expand = c(0, 0))

enter image description here

How can I solve this problem?

Mordy answered 27/2, 2015 at 21:57 Comment(0)
H
13

My preferred solution would be to reshape this to long format. Then you only need 1 geom_line call. Especially if you have many series, that's tidier. Same result as LyzandeR's 2nd chart.

library(ggplot2)
library(reshape2)

test2 <- melt(test, id.var='YEAR')
test2 <- na.omit(test2)

ggplot(test2, aes(x=YEAR, y=value, color=variable)) + 
  geom_line() +
  scale_color_manual(values=c('red', 'green')) +

  xlab("Year") + ylab("Percent") +
  scale_x_continuous(limits=c(1935, 1995), breaks = seq(1935, 1995, 5),
                     expand = c(0, 0)) + 
  scale_y_continuous(limits=c(0,50), breaks=seq(0, 50, 10), expand = c(0, 0))

enter image description here

You might consider adding a geom_point() call in addition to the line, so it's clear which points are real values and which are missing. Another advantage to the long format is that additional geoms take just 1 call each, as opposed to 1 per series each.

enter image description here

Hemispheroid answered 27/2, 2015 at 22:30 Comment(2)
Thanks, I had tried melt but missed out na.omit. How would I change linetype for each line?Mordy
Same way the colors are changed above. linetype=variable in the aes call, then (optionally) scale_linetype_manual if you want to specify what linetypeHemispheroid
M
6

You can remove them with na.omit:

library(ggplot2)
#use na.omit below
ggplot(na.omit(test), aes(x=YEAR)) + 
  geom_line(aes(y = A1), size=0.43, colour="red") +  
  geom_line(aes(y = A2), size=0.43, colour="green") +
  xlab("Year") + ylab("Percent") +
  scale_x_continuous(limits=c(1935, 1995), breaks = seq(1935, 1995, 5),
                     expand = c(0, 0)) + 
  scale_y_continuous(limits=c(0,50), breaks=seq(0, 50, 10), expand = c(0, 0))

enter image description here

EDIT

Using 2 separate data.frames with na.omit:

#test1 and test2 need to have the same column names
test1 <- test[1:2]
test2 <- tes[c(1,3)]
colnames(test2) <- c('YEAR','A1')

library(ggplot2)
ggplot(NULL, aes(y = A1, x = YEAR)) + 
  geom_line(data = na.omit(test1), size=0.43, colour="red") +  
  geom_line(data = na.omit(test2), size=0.43, colour="green") +
  xlab("Year") + ylab("Percent") +
  scale_x_continuous(limits=c(1935, 1995), breaks = seq(1935, 1995, 5),
                     expand = c(0, 0)) + 
  scale_y_continuous(limits=c(0,50), breaks=seq(0, 50, 10), expand = c(0, 0))

enter image description here

Moneybags answered 27/2, 2015 at 22:1 Comment(3)
OK, but why is the data before 1947 not plotted?Mordy
na.omit removes rows with NA. Otherwise you can't have them in the same dataframe.Moneybags
OK, but is it possible to plot multiple dataframes with ggplot?Mordy
B
1

You can remove them by subsetting your dataframe:

  ggplot(test, aes(x=YEAR)) + 
  geom_line(data=subset(test, !is.na(A1)),aes(y = A1), size=0.43, colour="red") +  
  geom_line(data=subset(test, !is.na(A2)),aes(y = A2), size=0.43, colour="green") +
  xlab("Year") + ylab("Percent") +
  scale_x_continuous(limits=c(1935, 1995), breaks = seq(1935, 1995, 5),
                     expand = c(0, 0)) + 
  scale_y_continuous(limits=c(0,50), breaks=seq(0, 50, 10), expand = c(0, 0))

enter image description here

Baptista answered 29/5, 2019 at 14:11 Comment(0)

© 2022 - 2024 — McMap. All rights reserved.