How to make kable table reactive() in shiny app? Shiny + kable
Asked Answered
S

2

13

I am trying to make kable table reactive and export it in shiny app. already gave a try with renderDataTable/renderTable inside server and output functions as datatableOutput/tableOutput, but of no luck and following is the line of code.

  output$tableset <- renderDataTable({
kable(spread_bole) %>%
  kable_styling(font_size = 15 ,bootstrap_options = c("striped","hover", "condensed")) })

tableOutput("tableset")      
Speedway answered 21/7, 2018 at 23:52 Comment(0)
M
18

Since kable returns HTML, you can render your table using htmlOutput in ui and renderText in server:

# UI component
htmlOutput("tableset") 

# server component
output$tableset <- renderText({
  kable(spread_bole) %>%
    kable_styling(
      font_size = 15,
      bootstrap_options = c("striped", "hover", "condensed")
    ) 
})

Additionally, if you want to make it responsive to user input, you can wrap it in a reactive expression:

my_table <- reactive({
  kable(spread_bole) %>%
    kable_styling(
      font_size = 15,
      bootstrap_options = c("striped", "hover", "condensed")
    )
})

# my_table() will call the cached table 

This will be especially helpful if you want to use the same table multiple times. You can check out eventReactive to trigger it with a specific input as well. Please refer here for more information on reactivity in Shiny: https://shiny.rstudio.com/articles/reactivity-overview.html

Midships answered 22/7, 2018 at 0:43 Comment(0)
T
2

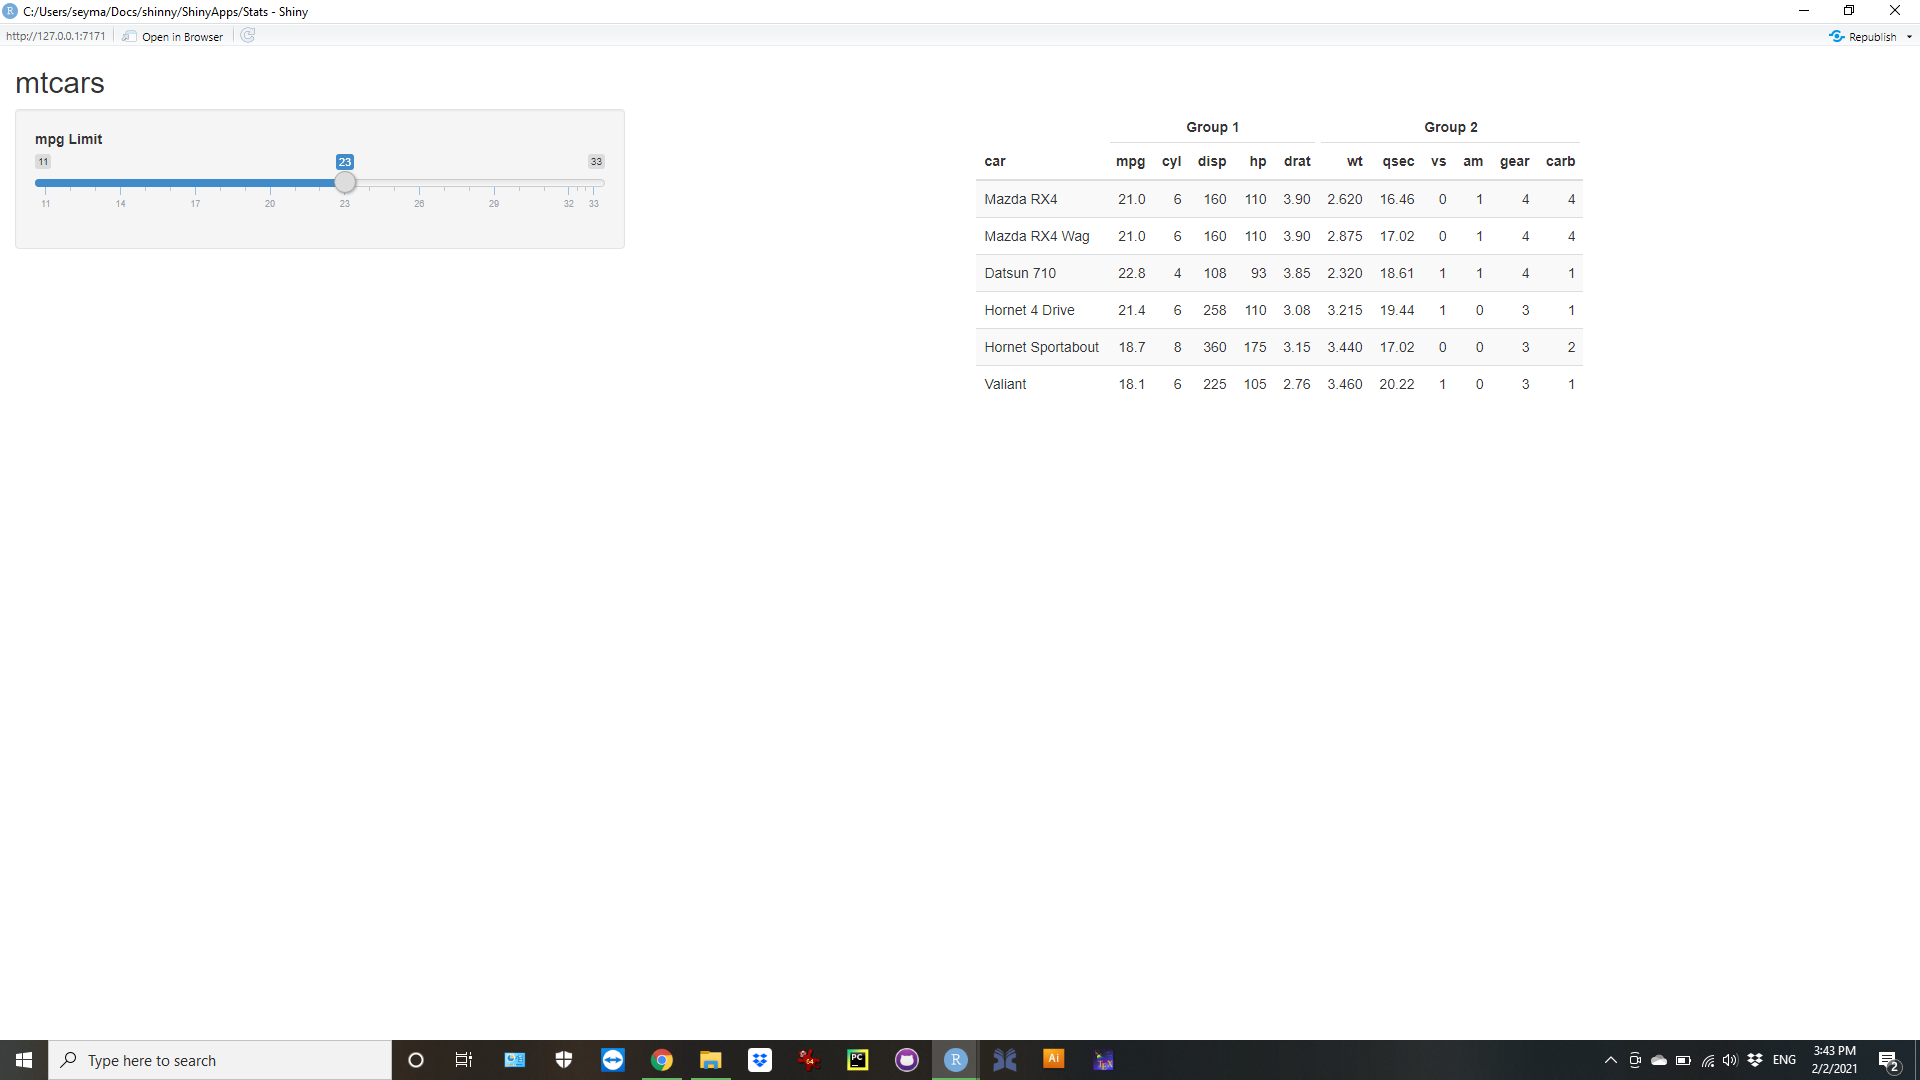
Hello was looking for the same and I found this works with a few changes

library(shiny)
library(tibble)
library(dplyr)
library(kableExtra)

data("mtcars"); head(mtcars,2)
mtcars <- rownames_to_column(mtcars, var="car") %>% head


ui <- fluidPage(
  
  # Application title
  titlePanel("mtcars"),
  
  sidebarLayout(
    sidebarPanel(
      sliderInput("mpg", "mpg Limit",
                  min = 11, max = 33, value = 20)
    ),
    
    mainPanel(
      tableOutput("mtcars_kable")
    )
  )
)

server <- function(input, output) {

  output$mtcars_kable <- function() {
    req(input$mpg)
      mtcars %>%
      #dplyr::mutate(car = rownames(.)) %>% 
      dplyr::select(car, everything()) %>%
      dplyr::filter(mpg <= input$mpg) %>%
      knitr::kable("html") %>%
      kable_styling("striped", full_width = F) %>%
      add_header_above(c(" ", "Group 1" = 5, "Group 2" = 6))
  }
}

# Run the application
shinyApp(ui = ui, server = server)

enter image description here

Theatricals answered 2/2, 2021 at 14:44 Comment(0)

© 2022 - 2024 — McMap. All rights reserved.