Xdebug unable to connect to client, where do I start debugging the debugger?
Asked Answered
L

3

13

I'm setting up xdebug for php within sublime text, and xdebug keeps on logging errors related to being unable to connect:

Log opened at 2016-08-18 21:06:01
I: Connecting to configured address/port: localhost:9988.
E: Could not connect to client. :-(
Log closed at 2016-08-18 21:06:01

I hoped that debugging directly by going to http://localhost:9988 in my browser might help, but it simply displays the google chrome error page: "localhost refused to connect". Perhaps the error exists on the other end, that data can't be pushed to the sublime text client, I don't know. Sublime text xdebug does show the message "Reloading /var/log/xdebug/xdebug.log" when I run tests/etc, so it seems to be aware of the php code being run, just doesn't get any further.

So, I never thought I would have to debug xdebug itself, but: How can I debug the xdebug to code editor connection? If this were nginx, I would start debugging the virtualhost, but since it's xdebug... ...I have no idea where to start debugging the lack of an app to connect to?

## Various Configuration Settings ##

I am on ubuntu linux 14.04.

Here is my xdebug.ini conf if pertinent:

[xdebug]
xdebug.default_enable=1
xdebug.remote_enable=1
xdebug.remote_autostart=1
xdebug.remote_host="localhost"
xdebug.remote_handler="dbgp"
xdebug.remote_port=9988
xdebug.remote_mode = req
xdebug.overload_var_dump=0
xdebug.idekey = sublime.xdebug
xdebug.remote_log="/var/log/xdebug/xdebug.log"
;https://github.com/martomo/SublimeTextXdebug

Xdebug installed:

apt-cache policy php-xdebug
php-xdebug:
  Installed: 2.4.0-5+donate.sury.org~trusty+1
  Candidate: 2.4.0-5+donate.sury.org~trusty+1
  Version table:
 *** 2.4.0-5+donate.sury.org~trusty+1 0
        500 http://ppa.launchpad.net/ondrej/php/ubuntu/ trusty/main amd64 Packages
        100 /var/lib/dpkg/status

Module active:

php -m | grep -i xdebug
xdebug
Xdebug

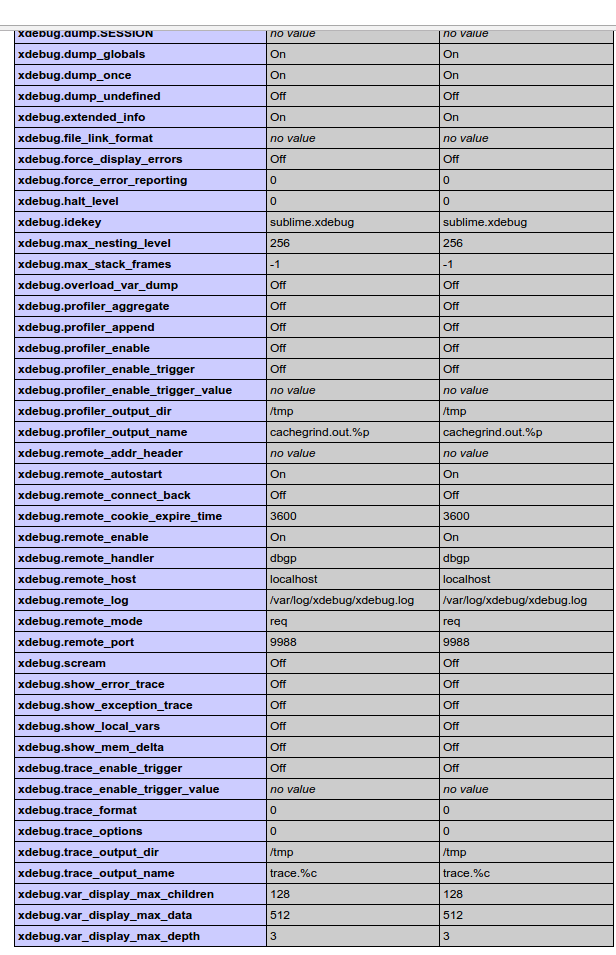
phpinfo xdebug settings:

xdebug settings via phpinfo

Lightly answered 18/8, 2016 at 21:19 Comment(6)
Probably should not matter, but try adding http:// before localhost in your remote_host propertyCymophane
@Cymophane Error message changed to: Log opened at 2016-08-22 13:40:28 I: Connecting to configured address/port: localhost:9988. E: Could not connect to client. :-( Log closed at 2016-08-22 13:40:28 Otherwise no difference.Lightly
Do you have a firewall that would block that port ?Circumrotate
What happens when you run telnet localhost 9988?Serrate
@Serrate Connection refused when I telnet to that port. When I connect to localhost port 80, it does connect (as I would expect) I would say the server for the app isn't running, but I have no idea what the server for xdebug is, nor how it specifies an open port. telnet localhost 9988 Trying 127.0.0.1... telnet: Unable to connect to remote host: Connection refused $ telnet localhost 80 Trying 127.0.0.1... Connected to localhost. Escape character is '^]'. MikeSimonson : Firewall is set to be permissive incoming & outgoing for that port.Lightly
Similar question: #24521253Lightly
S
22

PHP debugging requires two components that collaborate: a PHP extension that acts as server and a software that knows how to talk to this extension and drive its functionality (it is the client).

However, despite the usual client-server protocols where the client connects to the server, the PHP debugger works the other way around: the server is the one that connects to the client (that should be started and listening on port 9000).

xdebug is the most known PHP extension for debug. There are many programs and program extensions/plugins that acts as clients for it. I didn't work with Xdebug package for Sublime (I didn't work with Sublime, in the first place) but the principles are the same.

How a debugging session works?

The client software (Sublime with the Xdebug package in your case) starts listening on port 9000 of localhost, waiting for the server to start the connection. It probably doesn't listen on the port all the time but only when the developer tells it so.

You start the PHP script to debug. xdebug doesn't kick in on all requests to the server but only when it finds a marker in the request. Depending on the SAPI used to run the script, the marker is either an environment variable (for CLI scripts) or a cookie or a GET or POST argument (for web pages). Read more on the "Starting The Debugger" section of the documentation.

When the PHP interpreter starts the execution of the PHP script, if xdebug finds the marker explained above then it tries to connect the xdebug client. Otherwise, it stays out of the way and lets the script run at its full speed.

When the debugging marker is present in the environment, the xdebug extension (the server) tries to connect to the xdebug client (by default on port 9000 of localhost but these settings can be changed as needed). If it cannot connect (because the client is not listening) then it logs the failure then puts itself out of the way and lets the script run at its full speed.

After it successfully connects to the client, the xdebug PHP extension either stops before running the first statement of the PHP script or runs the script until its execution reaches a breakpoint. This behaviour and the list of breakpoints are sent by the client to the server during their initial communication as the connection was established. Then the extension waits for commands from the client. The client displays to the developer the current state of the running script (the next statement to run, the values of the variables in the current scope etc) and waits for commands (run next statement, continue, add/remove breakpoints, watch some variable etc).

Why it doesn't work for you?

It's not very clear for me from your question but I'll assume you run the webserver (with the PHP interpreter and the xdebug extension) on the same computer you run the xdebug client (localhost). If this is not the case, don't despair. The solution is a command line away (read at the end of the answer).

From the information you posted in the question is clear that xdebug is installed, enabled and it works properly. The output of telnet localhost 9988 says nobody is listening on port 9988. The xdebug client should listen there.

I never worked with Sublime Text (and its packages). This article explains how to install and make it work. However, it doesn't explain how to configure it to listen on port 9988.

I would start by setting the PHP xdebug extension to connect to the default port (9000):

xdebug.remote_port=9000

and then, if everything works, I would try to find out how to configure the Sublime Text xdebug package to listen on a different port. Do you really need it to listen on a different port?

What if the web server and the xdebug client are on different computers?

If you need to debug a PHP script that runs on a remote machine the xdebug client listens on the local machine (on port 9000) and the xdebug extension tries to connect to port 9000 on the remote machine. A solution that is possible in intranets and VPNs is to configure xdebug to connect to port 9000 of the local machine but, apart from these conditions, it usually also requires changes in the firewall and/or other security software.

The easiest way to debug the PHP scripts in this situation if you have ssh access to the remote machine is to create a ssh tunnel from port 9000 of the remote machine to port 9000 of the local machine.

Assuming you use ssh to connect to the remote machine (to put the files on it), all you have to do is to append -R 9000:localhost:9000 to the command line you use to connect and start a ssh session to the remote machine.

As long as this connection is open, any connection request on port 9000 (the first 9000 on the command line above) of the remote machine (-R) is forwarded through the tunnel to the port 9000 (the second 9000 from the command line) of the local machine (localhost). This way the remote xdebug PHP extension is able to contact the remote xdebug client (assuming it is listening).

Serrate answered 23/8, 2016 at 7:39 Comment(6)
I re-moved everything back to port 9000, but it still doesn't allow me to connect to that port. telnet localhost 9000 Trying 127.0.0.1... telnet: Unable to connect to remote host: Connection refusedLightly
I re-read your question now very carefully and something is not clear: do you have the Xdebug Client plugin installed in Sublime Text? Sublime Text needs it in order to be able to debug PHP scripts. If you have it installed then open Sublime Text and use the "Start Debugging" command from the "Tools -> Xdebug" menu. The Xdebug Client opens four tabs in Sublime Text. Open a console and run the telnet localhost 9000 command. It should work.Serrate
Yeah, definitely had the Xdebug client plugin installed (as the options you mention are available). After searching around this bug report: github.com/martomo/SublimeTextXdebug/issues/160 And finally getting some "Xdebug client has crashed" error messages (which did not appear at all before, possibly hardcoded against the 9000 port or something? Who knows), I think that it may be that the xdebug client crashes when using against Sublime Text 3 as opposed to Sublime Text 2. Going to report my findings & recommendations as a separate answer for others, and award bounty to you.Lightly
Never got any response other than "connection refused" from telnet localhost 9000, for some reason, despite getting some limited xdebug functionality (when the xdebug client is not in a crashed state).Lightly
I tried the SublimeText plugin with Sublime Text 3 on Linux Mint 17 and it worked fine for me. I also tried it a couple of days ago with Sublime Text 2 on OSX. Chrome was not involved in my tests (I saw references to some Chrome plugin on the bug you mentioned).Serrate
Amazing answer, I understood what was going with Xdebug thanks to this. A missing piece afterwards for me was mapping of the paths in VScode using "pathMappings" in launch.jsonPiero
D
2

If you are using xdebug-v3, please try:

xdebug.mode=debug
xdebug.start_with_request=yes
xdebug.discover_client_host=1

This should solve your issue.

Dangerous answered 22/3, 2021 at 22:2 Comment(1)
I don't know why.. It works. 😒Dunlin
L
1

Ok, so after extensive testings of different settings, here are my suggestions for debugging the problem for people who come after me:

  1. Do not rely on testing with only 1 xdebug client! It's trivial to install two editors/IDEs, so get an alternate editor running to make it possible to see whether there is a problem with xdebug, or with the specific client!

  2. There can be 3 locations that carry configuration for the xdebug+xdebug client combination! The client(or editor plugin) configuration, the 20-xdebug-conf.ini file (or in php.ini equivalent), and your project-specific configuration. Make sure all 3 locations are in sync in terms of port, path_mapping, etc.

Lightly answered 29/8, 2016 at 16:29 Comment(0)

© 2022 - 2024 — McMap. All rights reserved.