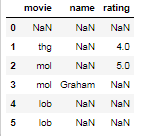
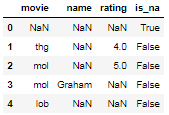
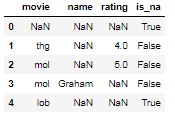
Kindly accept my apologies if my question has already been answered. I tried to find a solution but all I can find is to dropna solution for all NaN's in a dataframe. My question is that I have a dataframe with 6 columns and 500 rows. I need to check if in any particular row all the values are NaN so that I can drop them from my dataset. Example below row 2, 6 & 7 contains all Nan from col1 to col6:
    Col1    Col2    Col3    Col4    Col5    Col6
    12      25      02      78      88      90
    Nan     Nan     Nan     Nan     Nan     Nan
    Nan     35      03      11      65      53
    Nan     Nan     Nan     Nan     22      21
    Nan     15      93      111     165     153
    Nan     Nan     Nan     Nan     Nan     Nan
    Nan     Nan     Nan     Nan     Nan     Nan
    141     121     Nan     Nan     Nan     Nan
Please note that top row is just headings and from 2nd row on wards my data starts. Will be grateful if anyone can help me in right direction to solve this puzzle.
And also my 2nd question is that after deleting all Nan in all columns if I want to delete the rows where 4 or 5 columns data is missing then what will be the best solution.
and last question is, is it possible after deleting the rows with most Nan's then how can I create box plot on the remaining for example 450 rows?
Any response will be highly appreciated.
Regards,


