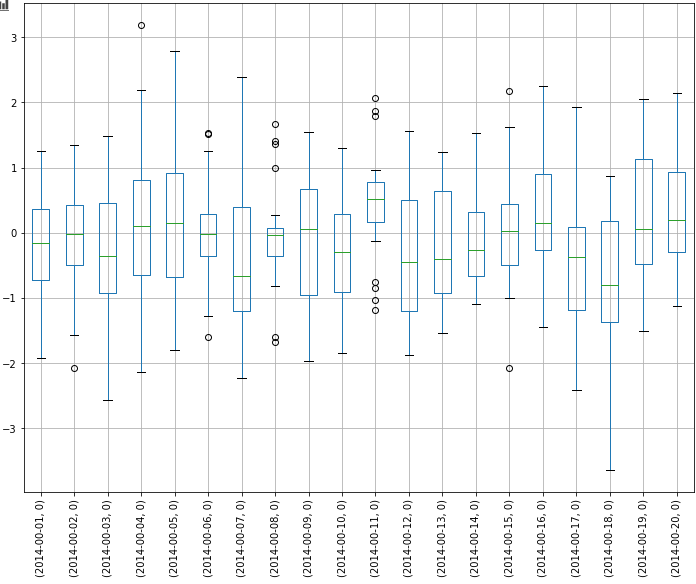
How can I create a boxplot for a pandas time-series where I have a box for each day?
Sample dataset of hourly data where one box should consist of 24 values:
import pandas as pd
n = 480
ts = pd.Series(randn(n),
               index=pd.date_range(start="2014-02-01",
                                   periods=n,
                                   freq="H"))
ts.plot()
I am aware that I could make an extra column for the day, but I would like to have proper x-axis labeling and x-limit functionality (like in ts.plot()), so being able to work with the datetime index would be great.
There is a similar question for R/ggplot2 here, if it helps to clarify what I want.


.boxplot()and.pivot()functions and does not require Seaborn – Slunk