Physical location of grafana dashboards [closed]
Asked Answered
W

2

13

In my project we use influx dB and Grafana for our log and other analysis which is running on an Ubuntu machine. Now recently due to a migration process, the ports were blocked like 3000(for Grafana) and 8086 (for influx dB) which will be remain blocked for some security reason. So, I am unable to connect them through the browser and postman.

So as a worked around we are planning to move these (at least the dashboards) to a local setup. I checked the process are up and running.

But unable to locate the physical location of the dashboard files.

I have a default setting, don't have any separate database configuration for grafana.

[database]
# You can configure the database connection by specifying type, host, name, user and password
# as separate properties or as on string using the url properties.

# Either "mysql", "postgres" or "sqlite3", it's your choice
;type = sqlite3
;host = 127.0.0.1:3306
;name = grafana
;user = root
# If the password contains # or ; you have to wrap it with triple quotes. Ex """#password;"""
;password =

# Use either URL or the previous fields to configure the database
# Example: mysql://user:secret@host:port/database
;url =

# For "postgres" only, either "disable", "require" or "verify-full"
;ssl_mode = disable

;ca_cert_path =
;client_key_path =
;client_cert_path =
;server_cert_name =

Is there any location where I can find these JSON file?

Weinhardt answered 23/1, 2021 at 13:55 Comment(0)
P
2

Look at whatever is starting grafana on your machine. It could be set up as a service, or run from a script like .bashrc potentially, or from docker. It does look like /var/lib/grafana could be the default place.

In my case on a RPi with influx, grafana etc using IOTstack, it is started from docker with docker-compose. The docker-compose.yml file defines the paths. It does look like /var/lib/grafana is the default place, but this can be remapped somewhere else. And it's likely to be mapped somewhere else in order to be backed up, ~/IOTstack/volumes/grafana/data, in my case.

  grafana:
container_name: grafana
image: grafana/grafana
restart: unless-stopped
user: "0"
ports:
- "3000:3000"
environment:
- GF_PATHS_DATA=/var/lib/grafana
- GF_PATHS_LOGS=/var/log/grafana
volumes:
- ./volumes/grafana/data:/var/lib/grafana
- ./volumes/grafana/log:/var/log/grafana
networks:
- iotstack_nw`
Phobos answered 26/1, 2021 at 14:45 Comment(2)
@Date what other services you have in the stack that is related to grafana ?Apeman
@Chang, There are many services that can be set up on the RPi with IOTstack, which runs them all from docker containers. I'm using node-red, influxdb, grafana, several python scripts to collect or modify data, other code for solar charge controller, inverter and microinverter monitoring. It can also do auto backups of everything to recover from trouble, and remote access too.Phobos
W
29

I figure it out by some research, thought I can help the community if someone same searching for the answer.

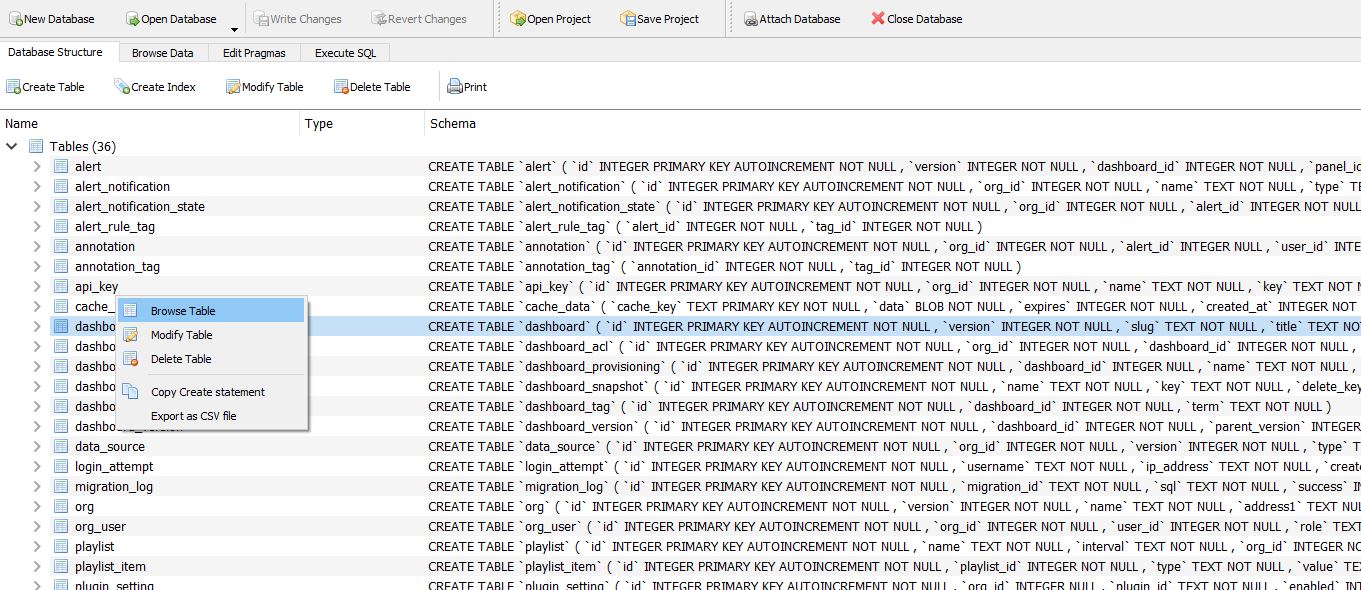
The default folder of the dashboard is /var/lib/grafana. If you navigate to the folder, you will find a file name grafana.db.

Download this file to your local machine or any machine which you want. Please download sqlitebrowser from here.

Now on the sqlitebrowser click on open database and select the grafana.db file. And right click on the dashboard table and select Browse Table. and select the data section and you will find the dashboard.

enter image description here

enter image description here

Weinhardt answered 23/1, 2021 at 16:35 Comment(1)
This assumes Grafana is configured with SQLite, and not a different persistence layerOccident
P
2

Look at whatever is starting grafana on your machine. It could be set up as a service, or run from a script like .bashrc potentially, or from docker. It does look like /var/lib/grafana could be the default place.

In my case on a RPi with influx, grafana etc using IOTstack, it is started from docker with docker-compose. The docker-compose.yml file defines the paths. It does look like /var/lib/grafana is the default place, but this can be remapped somewhere else. And it's likely to be mapped somewhere else in order to be backed up, ~/IOTstack/volumes/grafana/data, in my case.

  grafana:
container_name: grafana
image: grafana/grafana
restart: unless-stopped
user: "0"
ports:
- "3000:3000"
environment:
- GF_PATHS_DATA=/var/lib/grafana
- GF_PATHS_LOGS=/var/log/grafana
volumes:
- ./volumes/grafana/data:/var/lib/grafana
- ./volumes/grafana/log:/var/log/grafana
networks:
- iotstack_nw`
Phobos answered 26/1, 2021 at 14:45 Comment(2)
@Date what other services you have in the stack that is related to grafana ?Apeman
@Chang, There are many services that can be set up on the RPi with IOTstack, which runs them all from docker containers. I'm using node-red, influxdb, grafana, several python scripts to collect or modify data, other code for solar charge controller, inverter and microinverter monitoring. It can also do auto backups of everything to recover from trouble, and remote access too.Phobos

© 2022 - 2024 — McMap. All rights reserved.