nvd3 application memory leak
Asked Answered
F

2

14

I have a living linechart that updates frequently, see http://jsfiddle.net/cddw17fg/5/

function redraw() {
  if (!redraw.isGraphShown) {
    redraw.isGraphShown = true;
    ...
  } else {
    d3.select('#chart svg')
      .datum(data)
      .transition().duration(1500)
      .call(chart);

    d3.select('.nv-x.nv-axis > g').selectAll('g').selectAll('text')
      .attr('transform', function(d, i, j) {
      return 'translate (-40, 40) rotate(315)'
    });
    nv.tooltip.cleanup();
    chart.update();
  }
}

Running this js in IE11 with the "Development Tools" the "Total memory" increases slightly first, but after some minutes it starts growing fast.

After starting the jsfiddle the memory consumption looks 'good'... after startup but after some minutes someone gets hungry and eats my bytes... starting to eat memory
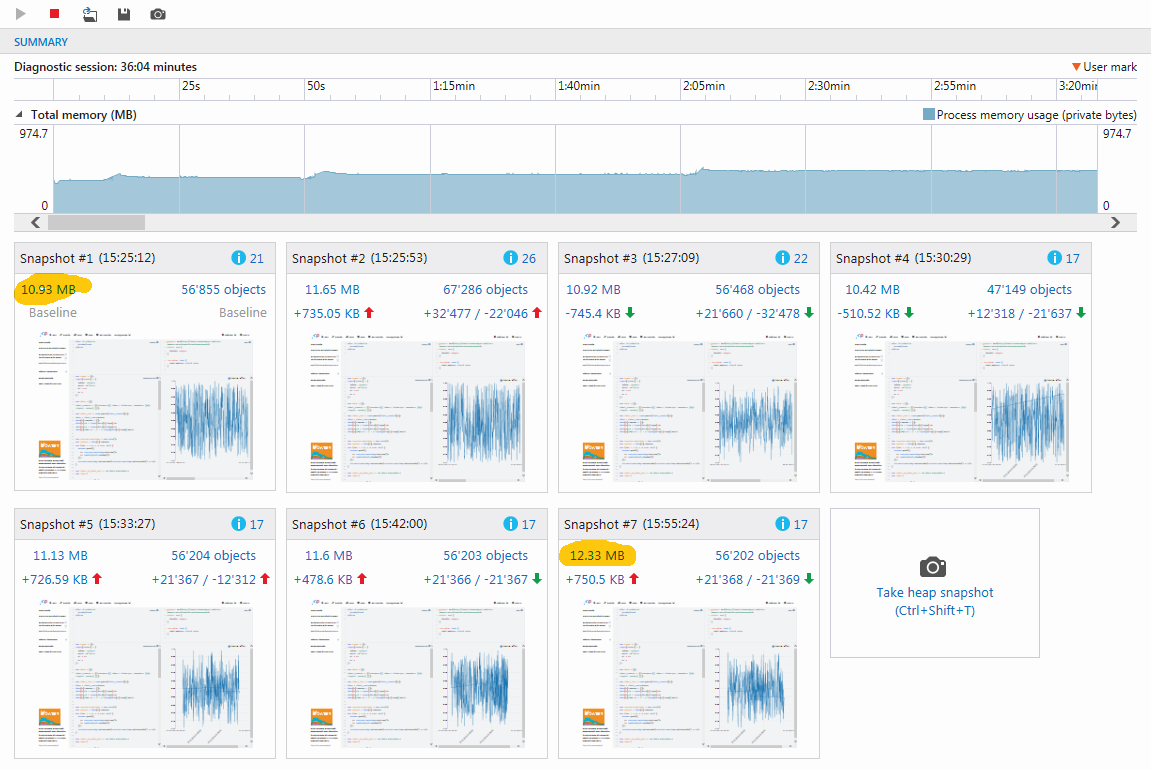
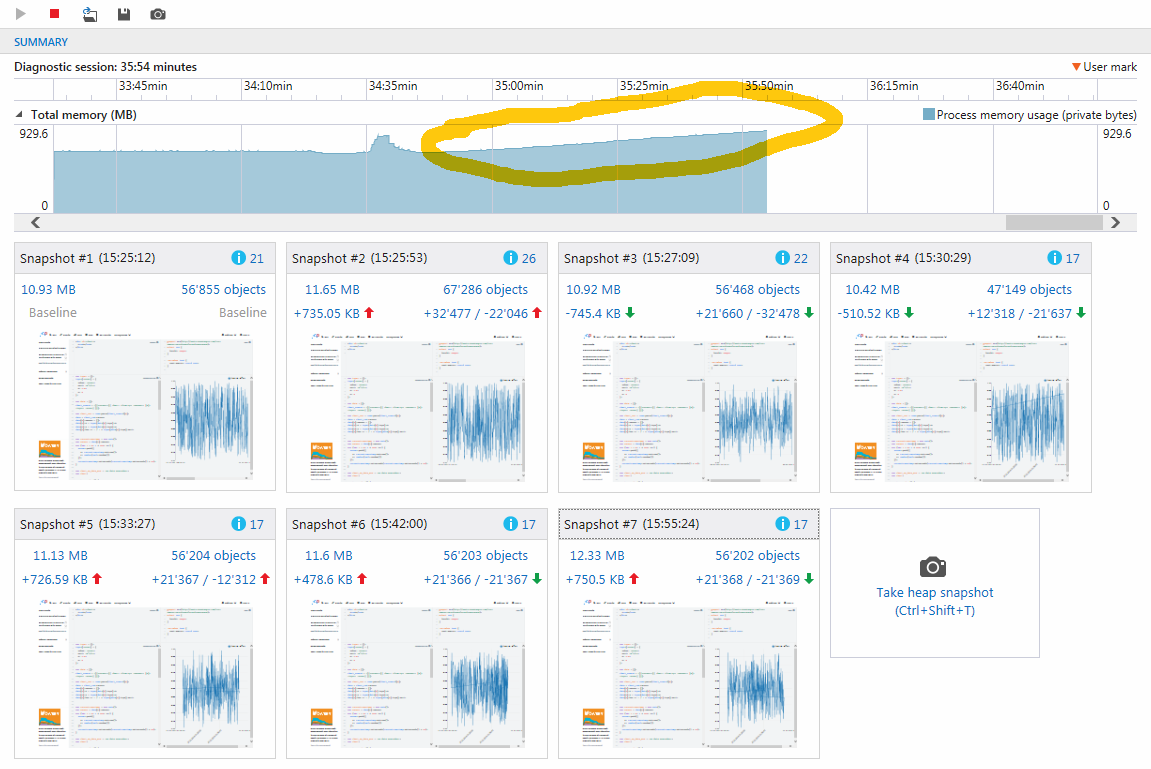
Anyone any clue about what I'm doing wrong?

Fortran answered 22/12, 2015 at 15:21 Comment(1)
Tried with latest 1.8.1 version at jsfiddle.net/3va0m0e4/2, looks like the same problem appears in chromeAnaglyph
F
0

It seems to be a bug in NVD3 or D3 itself. My workaround for now is to reload the page with the diagram every 10 min.

var startDateNVD3Reload = Date.now();
...
var elapsed_time_minutes = (Date.now() - startDateNVD3Reload)/1000/60;
if (elapsed_time_minutes > 10)
{
    location.reload(true);
}
Fortran answered 15/1, 2016 at 14:34 Comment(0)
W
2

I kept you fiddle running for 30 mins on one of the chrome tabs while i worked on something else and it crashed.

However if i keep the tab opened such that the tab never looses focus it never crashes and it keeps on working seamlessly.

Thus I am assuming that nvd3 does not update the graph but keeps all the update in a collection when the tab is in the blur state that's why the memory goes on increasing. Now when the focus is back on the tab it tries to render all the updates and screen freezes and eventually crashes.

Now as a fix:

I am using JQUERY to detect the window on focus:

$(window).focus(function() {
    window_focus = true;//set this flag on
}).blur(function() {
    window_focus = false;//set this flag off as window is not in display
});

Now inside your redraw function do chart update only when the window is in focus:

if(window_focus){
            chart.update();
            d3.select('#chart svg')
                .datum(data)
                //.transition().duration(1500)
                .call(chart);

            d3.select('.nv-x.nv-axis > g').selectAll('g').selectAll('text')
                .attr('transform', function(d, i, j) {
                    return 'translate (-40, 40) rotate(315)'
                });
            nv.tooltip.cleanup();

        }

Working code here

Hope this helps!

Wiggler answered 12/1, 2016 at 10:15 Comment(8)
I just tried your jsfiddle using IE11 and I reached 3.6 GB Total memory after 15 min - still growing... The chart was hidden by another tab during this time. (Unfortunately I cannot add the screenshot to this comment)Fortran
OK unfortunately i don't have an IE ... so can you check in the console if you can see "Not Called" when you run this jsfiddle.net/y3d5wdof/1 and change teh focus to some other tabWiggler
sorry try this fiddle jsfiddle.net/cyril123/y3d5wdof/3 and see if it works!Wiggler
OK, "Called" and "Not Called" show up. And I can see that it stops. I will check this and try something like "invisible" for user convenience.Fortran
Yes! the idea is that the chart does not update when the tab is not in focus...when it gets the focus it starts drawing.Wiggler
My test showed that it is much better now but I still have more and more objects hanging around. It seems that every time the chart looses and gets to focus back something is lost. Unfortunately...Fortran
Thats very strange coz when it looses focus we don't do anything..so very strange that the objects are growingWiggler
I let it running for some hours (with focus) and I'm already at above 1 GB memory consumption...Fortran
F
0

It seems to be a bug in NVD3 or D3 itself. My workaround for now is to reload the page with the diagram every 10 min.

var startDateNVD3Reload = Date.now();
...
var elapsed_time_minutes = (Date.now() - startDateNVD3Reload)/1000/60;
if (elapsed_time_minutes > 10)
{
    location.reload(true);
}
Fortran answered 15/1, 2016 at 14:34 Comment(0)

© 2022 - 2024 — McMap. All rights reserved.