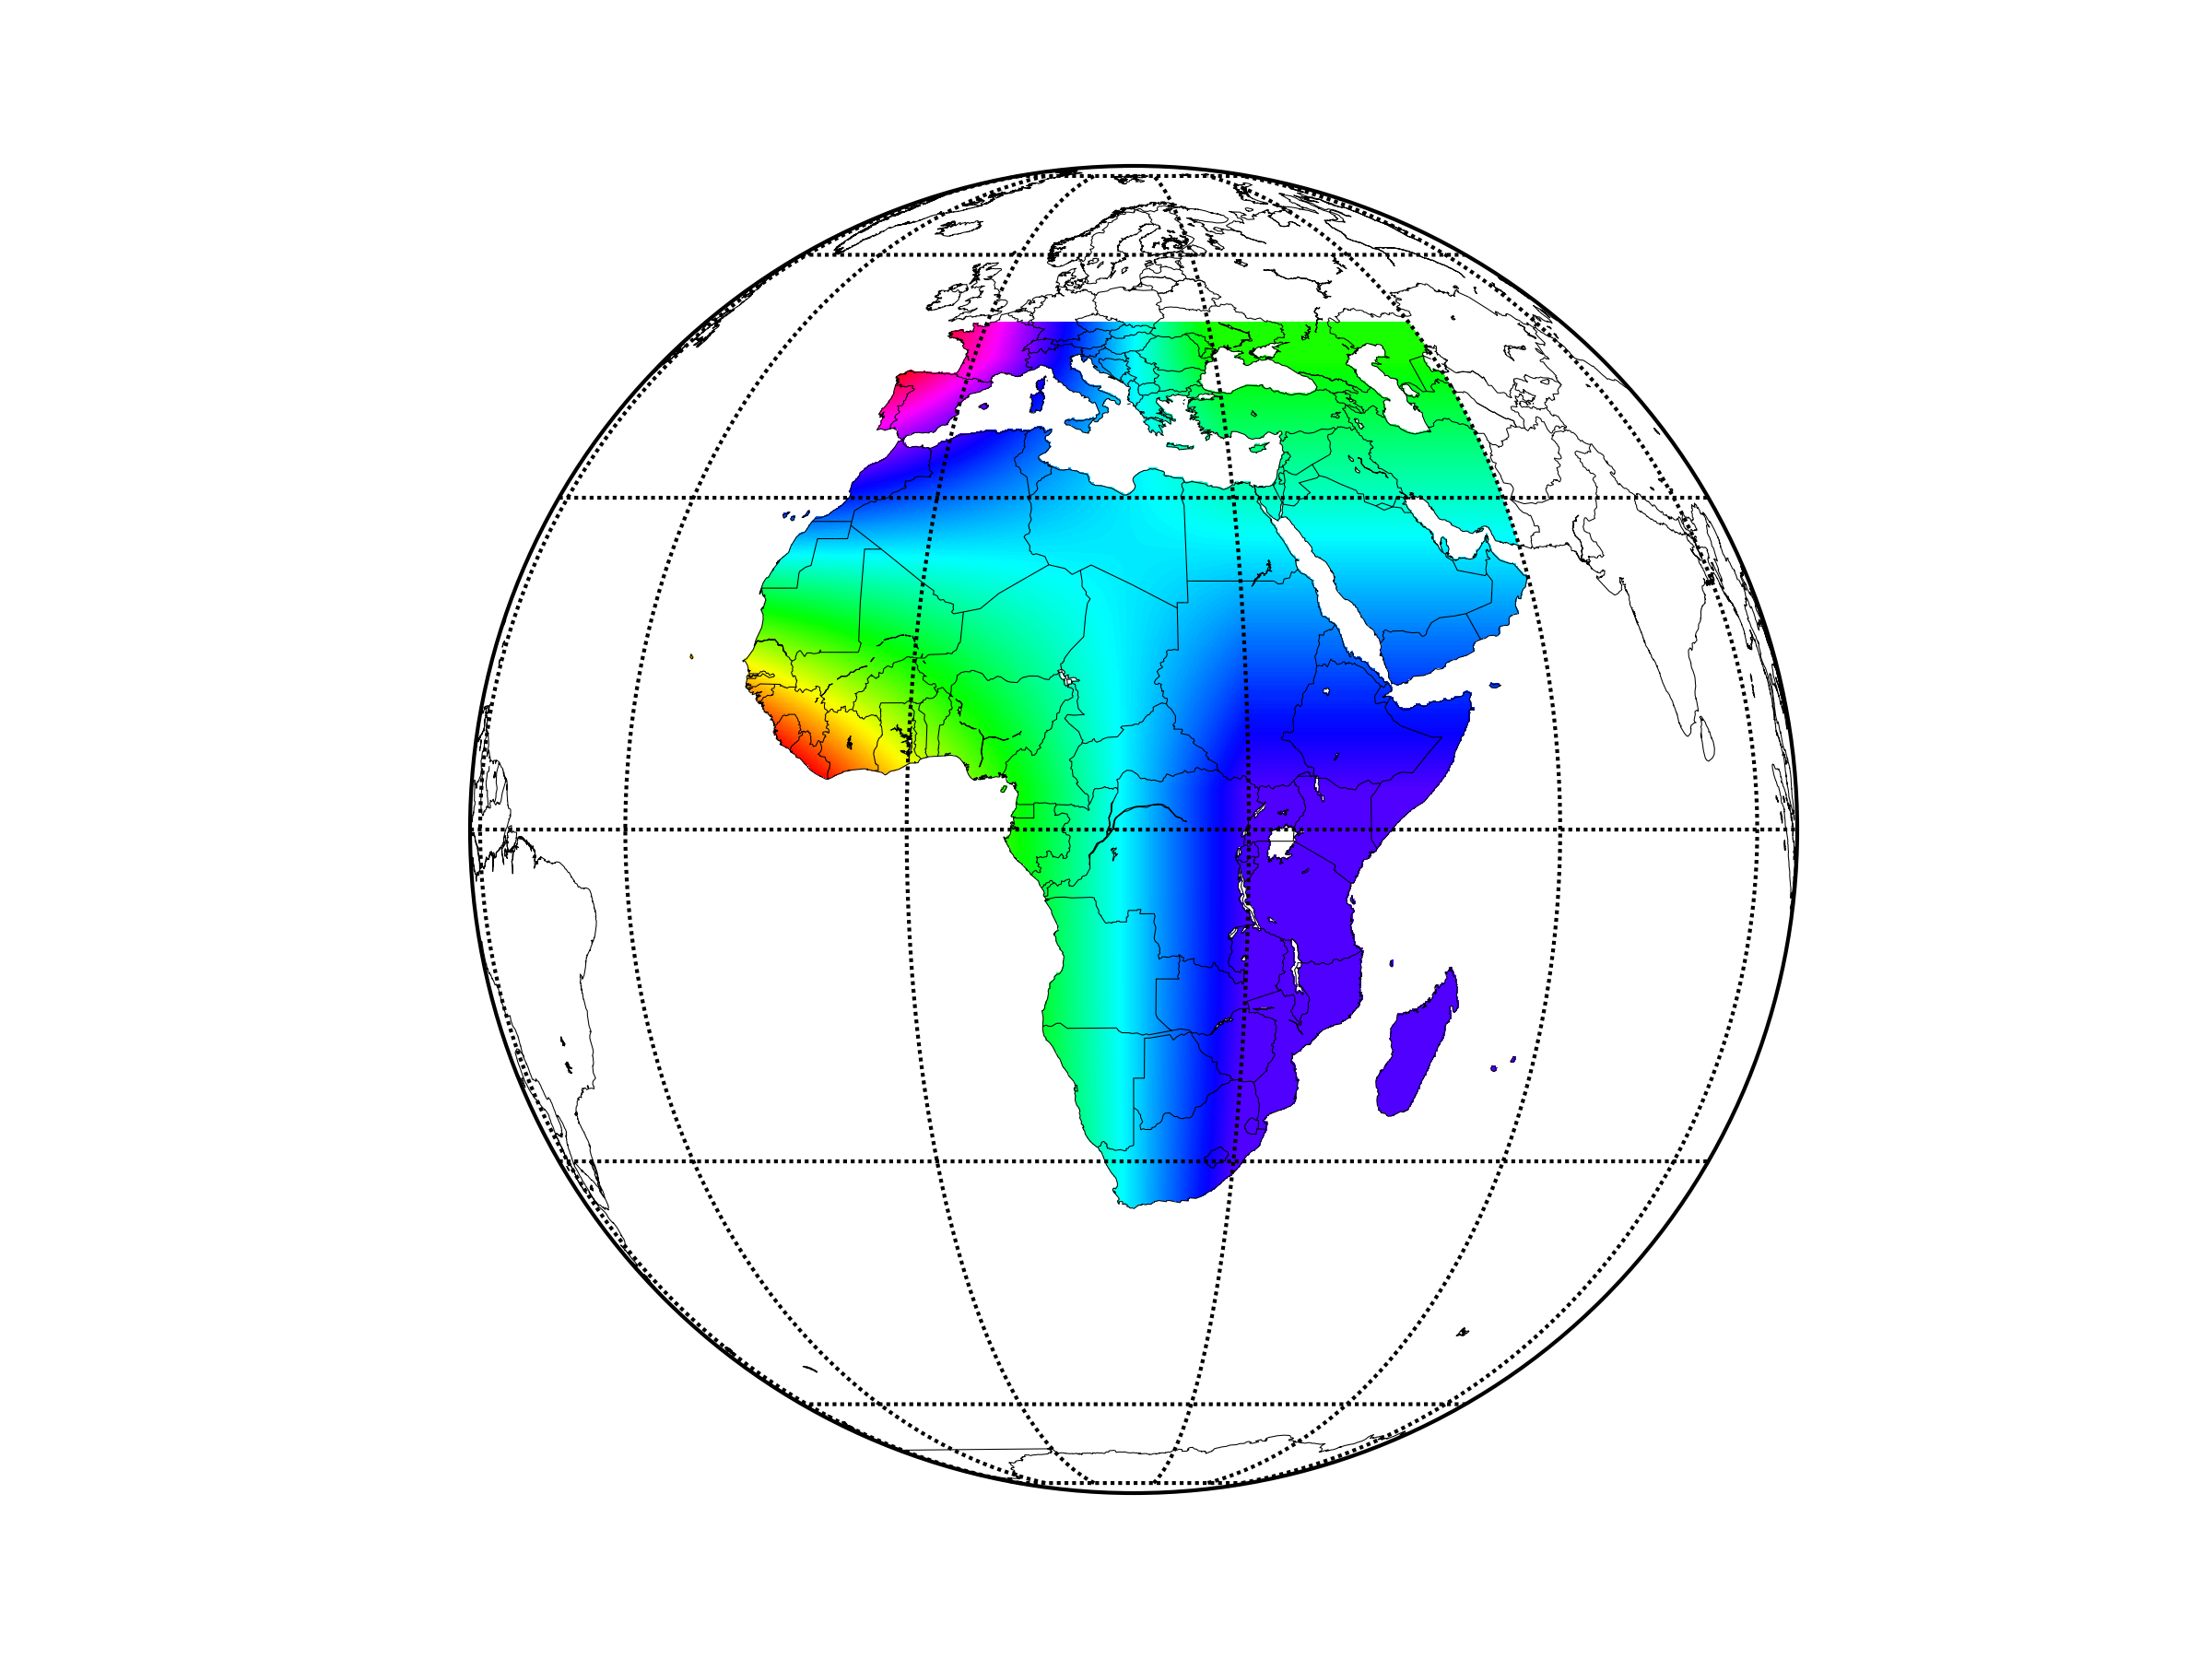
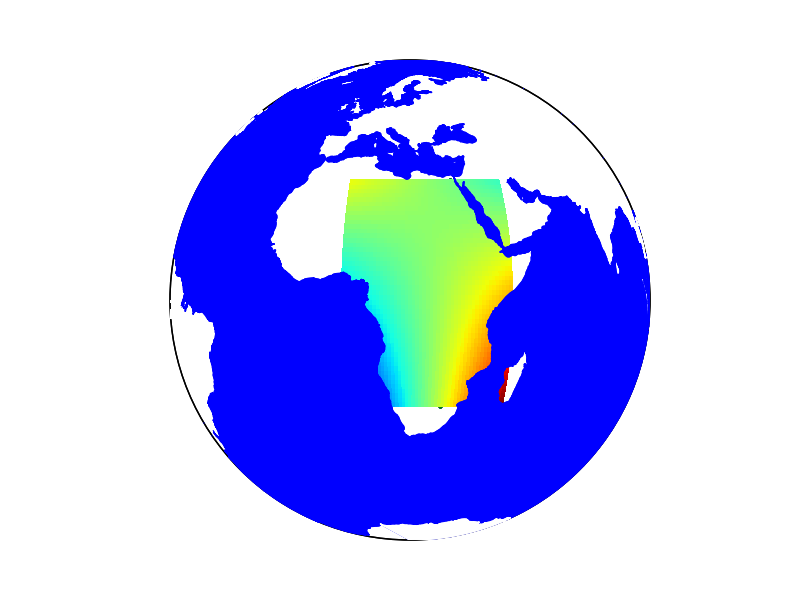
I know that matplotlib and scipy can do bicubic interpolation: http://matplotlib.org/examples/pylab_examples/image_interp.html http://docs.scipy.org/doc/scipy/reference/tutorial/interpolate.html http://docs.scipy.org/doc/scipy/reference/generated/scipy.interpolate.interp2d.html
I also know that it is possible to draw a map of the world with matplotlib: http://matplotlib.org/basemap/users/geography.html http://matplotlib.org/basemap/users/examples.html http://matplotlib.org/basemap/api/basemap_api.html
But can I do a bicubic interpolation based on 4 data points and only color the land mass?
For example using these for 4 data points (longitude and latitude) and colors:
Lagos: 6.453056, 3.395833; red HSV 0 100 100 (or z = 0)
Cairo: 30.05, 31.233333; green HSV 90 100 100 (or z = 90)
Johannesburg: -26.204444, 28.045556; cyan HSV 180 100 100 (or z = 180)
Mogadishu: 2.033333, 45.35; purple HSV 270 100 100 (or z = 270)
I am thinking that it must be possible to do the bicubic interpolation across the range of latitudes and longitudes and then add oceans, lakes and rivers on top of that layer? I can do this with drawmapboundary. Actually there is an option maskoceans for this:
http://matplotlib.org/basemap/api/basemap_api.html#mpl_toolkits.basemap.maskoceans
I can interpolate the data like this:
xnew, ynew = np.mgrid[-1:1:70j, -1:1:70j]
tck = interpolate.bisplrep(x, y, z, s=0)
znew = interpolate.bisplev(xnew[:,0], ynew[0,:], tck)
Or with scipy.interpolate.interp2d:
http://docs.scipy.org/doc/scipy/reference/generated/scipy.interpolate.interp2d.html
Here it is explained how to convert to map projection coordinates: http://matplotlib.org/basemap/users/mapcoords.html
But I need to figure out how to do this for a calculated surface instead of individual points. Actually there is an example of such a topographic map using external data, which I should be able to replicate: http://matplotlib.org/basemap/users/examples.html
P.S. I am not looking for a complete solution. I would much prefer to solve this myself. Rather I am looking for suggestions and hints. I have been using gnuplot for more than 10 years and only switched to matplotlib within the past few weeks, so please don't assume I know even the simplest things about matplotlib.


