++++++++++++++++
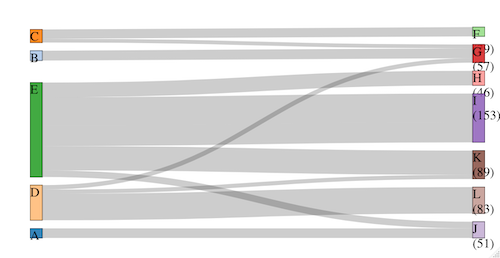
Update: I think the answer to my question is that you can't put line breaks in. A colleague pointed out to me the node labels are SVG blocks, which don't support line breaks.
++++++++++++++++
How do I put a line break into the node labels for a sankey diagram produced using the networkD3 R package?
Borrowing the example from Place text values to right of sankey diagram I can add values to the lables:
library(networkD3)
library(data.table)
set.seed(1999)
links <- data.table(
  src = rep(0:4, times=c(1,1,2,3,5)),
  target = sample(1:11, 12, TRUE),
  value = sample(100, 12)
)[src < target, ]  # no loops
nodes <- data.table(name=LETTERS[1:12])

#### Need to hover to get counts
##sankeyNetwork(Links=links, Nodes=nodes, Source='src', Target='target',
##  Value='value', NodeID='name', fontSize=16)

## Add text to label
txt <- links[, .(total = sum(value)), by=c('target')]
nodes[txt$target+1L, name := paste0(name, ' (', txt$total, ')')]

## Displays the counts as part of the labels
sankeyNetwork(Links=links, Nodes=nodes, Source='src', Target='target',
  Value='value', NodeID='name', fontSize=16, width=600, height=300)
I hoped that I could naively adjust the paste0 to include a line break character, such as:
name := paste0(name, "\n ", txt$total)
or
name := paste0(name, "<br/> ", txt$total)
But I haven't been able to get anything to work, and my JavaScript is too rusty to try and fix it once it is produced.

