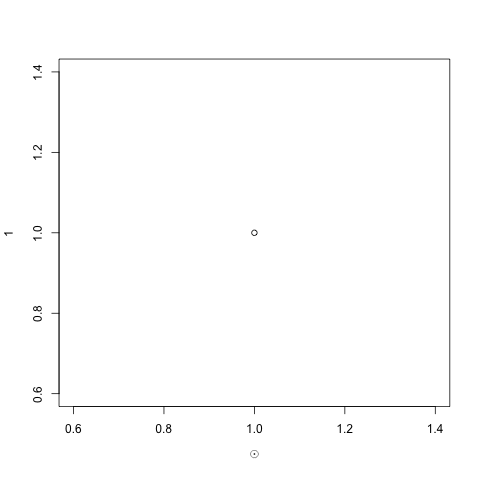
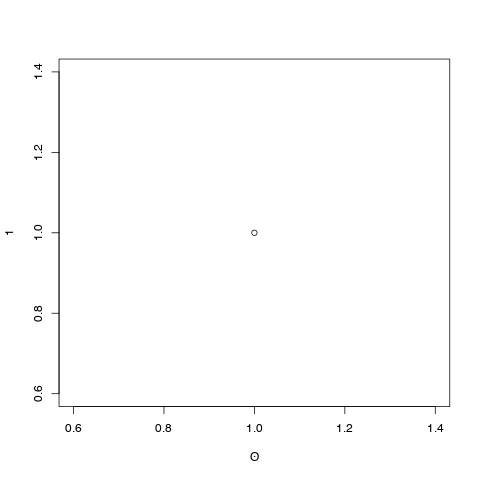
our sysadmin just upgraded our operating system to SLES12SP1. I reinstalled Rv3.2.3 and tried to make plots. I use cairo_pdf and try to make a plot with the x-label being \u0298 i.e. the solar symbol, but it doesn't work: the label just comes out blank. For example:
cairo_pdf('Rplots.pdf')
plot(1, xlab='\u0298') # the x-label comes up blank
dev.off()
This used to work, but for some reason it does not anymore. It works with other characters, e.g.
cairo_pdf('Rplots.pdf')
plot(1, xlab='\u2113') # the x-label comes up with the \ell symbol
dev.off()
When I just paste in the solar symbol, i.e.
plot(1, xlab='ʘ')
then I get the warning
Warning messages:
1: In title(...) :
  conversion failure on 'ʘ' in 'mbcsToSbcs': dot substituted for <ca>
The machine is German, but I am using the US English UTF-8 locale:
> sessionInfo()
R version 3.2.3 (2015-12-10)
Platform: x86_64-pc-linux-gnu (64-bit)
Running under: SUSE Linux Enterprise Server 12 SP1

locale:
 [1] LC_CTYPE=en_US.UTF-8       LC_NUMERIC=C
 [3] LC_TIME=en_US.UTF-8        LC_COLLATE=en_US.UTF-8
 [5] LC_MONETARY=en_US.UTF-8    LC_MESSAGES=en_US.UTF-8
 [7] LC_PAPER=en_US.UTF-8       LC_NAME=C
 [9] LC_ADDRESS=C               LC_TELEPHONE=C
[11] LC_MEASUREMENT=en_US.UTF-8 LC_IDENTIFICATION=C
Any tips on how I can get the solar symbol to appear?


