ggplot legend - scale_colour_manual not working
Asked Answered
D

2

3

I am trying to add a legend to my graphs, but nothing ever shows up. This is the code I have:

ggplot(main, aes(x = ceiling(session/2))) + 
geom_line(aes(y = C_overall), colour = "blue", stat = "summary", fun.y = "mean") +
geom_line(aes(y = I_overall), colour = "red", stat = "summary", fun.y = "mean") +
labs(title = 'Overall Accuracy', x = 'Session', y = 'Percent Accurate') +
facet_wrap(~bird)

This shows me what I want, except with no legend. Everything I've seen says to use scale_colour_manual like this:

ggplot(main, aes(x = ceiling(session/2))) + 
geom_line(aes(y = C_overall), colour = "one", stat = "summary", fun.y = "mean") +
geom_line(aes(y = I_overall), colour = "two", stat = "summary", fun.y = "mean") +
labs(title = 'Overall Accuracy', x = 'Session', y = 'Percent Accurate') +
facet_wrap(~bird) +
scale_colour_manual(name = 'Congruency', values = c("one" = "blue", "two" = "red"))

This seems to work for everyone else, but R just tells me that 'one' is an invalid color name. I've worked on this for hours and I'm nowhere closer to figuring this out.

Here is some of my data if it's helpful:

bird   session  C_overall   I_overall
23W     1       42.5        42.5
23W     2       46.25       47.5
23W     3       51.25       57.5
23W     4       47.5        52.5
23W     5       47.5        52.5
23W     6       47.5        62.5
23W     7       52.5        52.5
23W     8       50          55
23W     9       51.25       52.5
23W     10      48.75       47.5
43R     1       47.5        42.5
43R     2       43.75       37.5
43R     3       58.75       40
43R     4       51.25       40
43R     5       51.25       52.5
43R     6       36.25       35
43R     7       53.75       40
43R     8       57.5        45
43R     9       61.25       52.5
43R     10      48.75       47.5
57Y     1       45          67.5
57Y     2       53.75       62.5
57Y     3       47.5        65
57Y     4       52.5        52.5
57Y     5       47.5        50
57Y     6       48.75       70
57Y     7       66.25       72.5
57Y     8       55          60
57Y     9       57.5        72.5
57Y     10      58.75       67.5
76B     1       51.25       50
76B     2       56.25       42.5
76B     3       60          60
76B     4       68.75       70
76B     5       73.75       75
76B     6       55          52.5
76B     7       68.75       62.5
76B     8       40          40
76B     9       57.5        55
76B     10      66.25       70

The blue line should be "Congruent" and the red line should be "Incongruent".

Any help about how to make a legend would be greatly appreciated! Thanks in advance!!

Don answered 14/11, 2015 at 0:35 Comment(0)
F
3

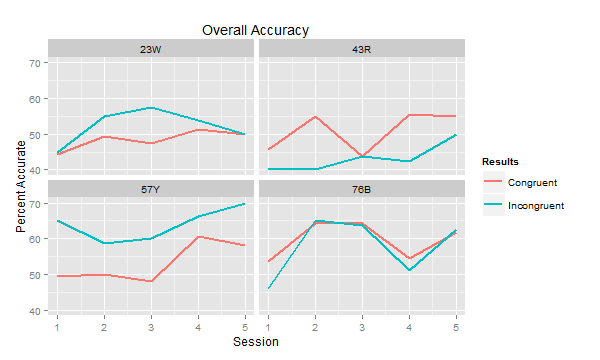
I would convert the data into long format before plotting:

library(reshape2)

main <- melt(main, c("bird", "session"))

ggplot(main, aes(x=ceiling(session/2), y=value, color=variable)) + 
  geom_line(stat="summary", fun.y="mean", size=1) +
  labs(title="Overall Accuracy", x="Session", y="Percent Accurate") +
  facet_wrap(~ bird) +
  scale_color_discrete("Results", labels=c("Congruent", "Incongruent"))

enter image description here

Would that work for you?

Fabio answered 14/11, 2015 at 0:50 Comment(4)
It is perfect! I actually have other columns in my data file though, that I use to make other graphs. When I use this code with the other columns in the data file I get the error message 'attributes are not identical across measure variables; they will be dropped' and the graph is messed up, but when I deleted the extra columns in a new document is does work. Do you know how to change the code so that it only uses the C_overall and I_overall columns? - I apologize I didn't add that in the original question, I didn't know it would make a difference.Don
try to add all other columns you are not using in this plot to id.vars parameter of melt(), i.e. do melt(main, c("bird", "session", "col1", "col2", ...))Fabio
Alternatively, just restrict the columns you use, i.e. do ggplot(main[,c("bird", "session", "C_overall", "I_overall")], aes(...)) + ... and so onFabio
You're most welcome! Please don't forget to accept the answer :) P.S. you can also have nicer labels on the y axis if you specify scale_y_continuous(labels=percent) (just don't forget to divide value by 100 and import library(scales))Fabio
J
1

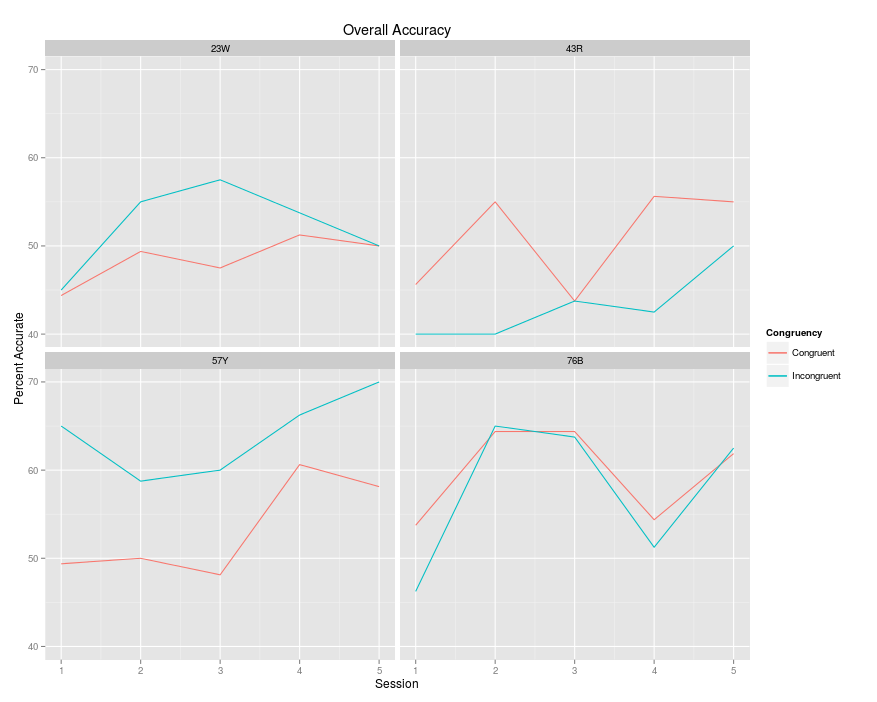
Make following changes in geom_lines and scale_color_discreteand you are good to go.

ggplot(main, aes(x = ceiling(session/2))) + 
## changes in line below
geom_line(aes(y = C_overall, colour = "Congruent"), stat = "summary", fun.y = "mean") +
## changes in line below
geom_line(aes(y = I_overall, colour = "Incongruent"), stat = "summary", fun.y = "mean") +
labs(title = 'Overall Accuracy', x = 'Session', y = 'Percent Accurate') +
facet_wrap(~bird) +
# changes in line below
scale_color_discrete("Congruency")

enter image description here

Jarrad answered 14/11, 2015 at 2:16 Comment(1)
This is not the kind of solution that will work long-term. While this is a hack that works in this case, it isn't the way to use ggplot2 You want to map the aesthetic to a variable in the data frame, as indicated in Sergiy's answer aes(color=variable).Xochitlxp

© 2022 - 2024 — McMap. All rights reserved.