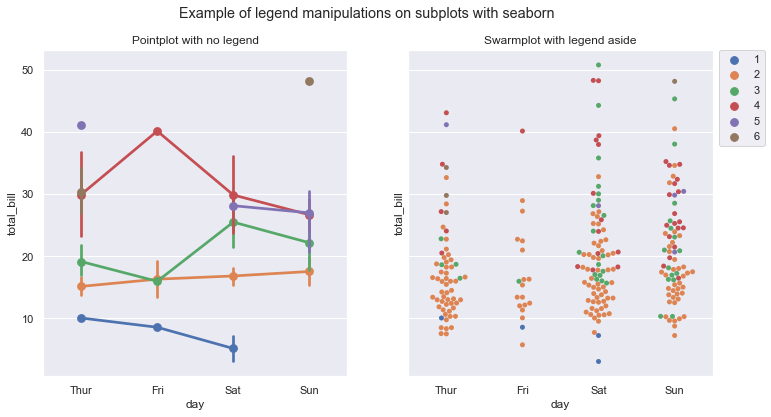
Here is a more complex example of legend removal and manipulation with matplotlib and seaborn dealing with subplots:
From seaborn, get the Axes object created by sns.<some_plot>() and do ax.get_legend().remove() as indicated by @naitsirhc. The following example also shows how to put the legend aside, and how to deal in a context of subplots.
# imports
import seaborn as sns
import matplotlib.pyplot as plt

# get data
sns.set()
sns.set_theme(style="darkgrid")
tips = sns.load_dataset("tips")

# subplots
fig, axes = plt.subplots(1, 2, sharex=True, sharey=True, figsize=(12,6))
fig.suptitle('Example of legend manipulations on subplots with seaborn')

g0 = sns.pointplot(ax=axes[0], data=tips, x="day", y="total_bill", hue="size")
g0.set(title="Pointplot with no legend")
g0.get_legend().remove() # <<< REMOVE LEGEND HERE

g1 = sns.swarmplot(ax=axes[1], data=tips, x="day", y="total_bill", hue="size")
g1.set(title="Swarmplot with legend aside")
# change legend position: https://www.statology.org/seaborn-legend-position/
g1.legend(bbox_to_anchor=(1.02, 1), loc='upper left', borderaxespad=0)
![Example of legend manipulations on subplots with seaborn]()

