Nonparametric quantile regression curves to scatterplot
Asked Answered
B

3

14

I created a scatterplot (multiple groups GRP) with IV=time, DV=concentration. I wanted to add the quantile regression curves (0.025,0.05,0.5,0.95,0.975) to my plot.

And by the way, this is what I did to create the scatter-plot:

attach(E)  ## E is the name I gave to my data
## Change Group to factor so that may work with levels in the legend
Group<-as.character(Group)
Group<-as.factor(Group)

## Make the colored scatter-plot
mycolors = c('red','orange','green','cornflowerblue')
plot(Time,Concentration,main="Template",xlab="Time",ylab="Concentration",pch=18,col=mycolors[Group])

## This also works identically
## with(E,plot(Time,Concentration,col=mycolors[Group],main="Template",xlab="Time",ylab="Concentration",pch=18))

## Use identify to identify each point by group number (to check)
## identify(Time,Concentration,col=mycolors[Group],labels=Group)
## Press Esc or press Stop to stop identify function

## Create legend
## Use locator(n=1,type="o") to find the point to align top left of legend box
legend('topright',legend=levels(Group),col=mycolors,pch=18,title='Group')

Because the data that I created here is a small subset of my larger data, it may look like it can be approximated as a rectangular hyperbole. But I don't want to call a mathematical relationship between my independent and dependent variables yet.

I think nlrq from the package quantreg may be the answer, but I don't understand how to use the function when I don't know the relationship between my variables.

I find this graph from a science article, and I want to do precisely the same kind of graph: Goal

Again, thanks for your help!

Update

Test.csv I was pointed out that my sample data is not reproducible. Here is a sample of my data.

library(evd)
qcbvnonpar(p=c(0.025,0.05,0.5,0.95,0.975),cbind(TAD,DV),epmar=T,plot=F,add=T)

I also tried qcbvnonpar::evd,but the curve doesn't seem very smooth.

Bedpan answered 22/2, 2013 at 1:51 Comment(8)
If you are unable to provide your own data, try creating a dataset of random numbers and demonstrate your problem. Show us what you've tried. It gives us something to work with as well as being a sign of good faith.Cryptonym
Oh. I'm sorry--I will make some numbers up. It may be rather large.Bedpan
This may help you in generating data. #5963769Unpile
A couple of comments: the figure you show appears to be from works.bepress.com/phil_reiss/16 ? That paper appears to have an associated R package (haven't looked at it ...) It's going to be rather hard (I think) to get completely nonparametric, smooth quantiles. Two possible solutions are (1) fit generalized additive models (e.g. library(splines); rq(y~s(x,5),tau=0.9)); (2) use running estimates of the quantiles.Selfimmolating
How big is your data set?Selfimmolating
maybe rqss() from quantreg may also suit you?Enthymeme
@Roman Luštrik: I will save this page for future reference. It seems my question isn't reproducible with a smaller dataset, and I think I saw someone post a dropbox link to a large file, and I may do the same in the futureBedpan
@BenBolker: Oh, I should have cited: link. I thought I replied yesterday but the comment didn't show up, my n=1000 approximatelyBedpan
C
5

I have in the past frequently struggled with rqss and my issues have almost always been related to the ordering of the points.

You have multiple measurements at various time points, which is why you're getting different lengths. This works for me:

dat <- read.csv("~/Downloads/Test.csv")

library(quantreg)
dat <- plyr::arrange(dat,Time)
fit<-rqss(Concentration~qss(Time,constraint="N"),tau=0.5,data = dat)
with(dat,plot(Time,Concentration))
lines(unique(dat$Time)[-1],fit$coef[1] + fit$coef[-1])

enter image description here

Sorting the data frame prior to fitting the model appears necessary.

Conversational answered 28/2, 2013 at 15:45 Comment(1)
This works! Thank you so much. I didn't know that ordering could be an issue.Bedpan
E
8

Maybe have a look at quantreg:::rqss for smoothing splines and quantile regression. Sorry for the not so nice example data:

set.seed(1234)
period <- 100
x <- 1:100
y <- sin(2*pi*x/period) + runif(length(x),-1,1)


require(quantreg)
mod <- rqss(y ~ qss(x))
mod2 <- rqss(y ~ qss(x), tau=0.75)
mod3 <- rqss(y ~ qss(x), tau=0.25)
plot(x, y)
lines(x[-1], mod$coef[1] + mod$coef[-1], col = 'red')
lines(x[-1], mod2$coef[1] + mod2$coef[-1], col = 'green')
lines(x[-1], mod3$coef[1] + mod3$coef[-1], col = 'green')

enter image description here

Enthymeme answered 22/2, 2013 at 15:54 Comment(3)
+1 for rqss() - if non-parametric is what is required and the example image suggests it is a spline-based fit then rqss() is certainly the first place I would look.Heaviside
It works so beautifully with your example, but I am not sure why, I keep getting Error in xy.coords(x, y) : 'x' and 'y' lengths differ warning for my dataset even though I check that my x and y have the same n. Still working on error debugging :PBedpan
Can you give use a little more of your data? Your example data from above is obviously not appropriate.Enthymeme
C
5

I have in the past frequently struggled with rqss and my issues have almost always been related to the ordering of the points.

You have multiple measurements at various time points, which is why you're getting different lengths. This works for me:

dat <- read.csv("~/Downloads/Test.csv")

library(quantreg)
dat <- plyr::arrange(dat,Time)
fit<-rqss(Concentration~qss(Time,constraint="N"),tau=0.5,data = dat)
with(dat,plot(Time,Concentration))
lines(unique(dat$Time)[-1],fit$coef[1] + fit$coef[-1])

enter image description here

Sorting the data frame prior to fitting the model appears necessary.

Conversational answered 28/2, 2013 at 15:45 Comment(1)
This works! Thank you so much. I didn't know that ordering could be an issue.Bedpan
T
2

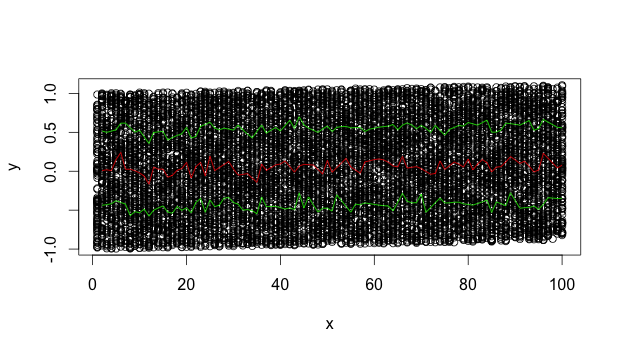
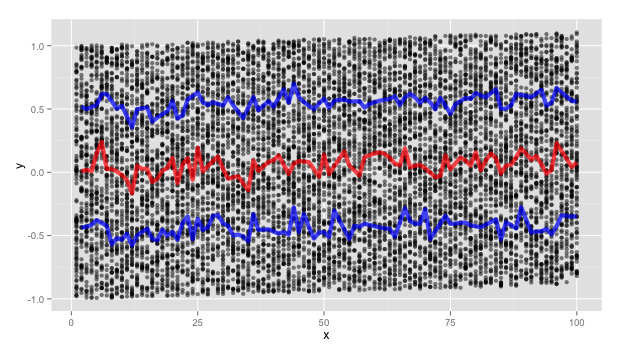
In case you want ggplot2 graphic...

I based this example on that of @EDi. I increased the x and y so that the quantile lines would be less wiggly. Because of this increase, I need to use unique(x) in place of x in some of the calls.

Here's the modified set-up:

set.seed(1234)
period <- 100
x <- rep(1:100,each=100)
y <- 1*sin(2*pi*x/period) + runif(length(x),-1,1)


require(quantreg)
mod <- rqss(y ~ qss(x))
mod2 <- rqss(y ~ qss(x), tau=0.75)
mod3 <- rqss(y ~ qss(x), tau=0.25)

Here are the two plots:

# @EDi's base graphics example
plot(x, y)
lines(unique(x)[-1], mod$coef[1] + mod$coef[-1], col = 'red')
lines(unique(x)[-1], mod2$coef[1] + mod2$coef[-1], col = 'green')
lines(unique(x)[-1], mod3$coef[1] + mod3$coef[-1], col = 'green')

enter image description here

# @swihart's ggplot2 example:
## get into dataset so that ggplot2 can have some fun:
qrdf <- data.table(x       = unique(x)[-1],
                   median =  mod$coef[1] +  mod$coef[-1],
                   qupp   = mod2$coef[1] + mod2$coef[-1],
                   qlow   = mod3$coef[1] + mod3$coef[-1]
)

line_size = 2
ggplot() +
  geom_point(aes(x=x, y=y),
             color="black", alpha=0.5) +
  ## quantiles:
  geom_line(data=qrdf,aes(x=x, y=median),
            color="red", alpha=0.7, size=line_size) +
  geom_line(data=qrdf,aes(x=x, y=qupp),
            color="blue", alpha=0.7, size=line_size, lty=1) +
  geom_line(data=qrdf,aes(x=x, y=qlow),
            color="blue", alpha=0.7, size=line_size, lty=1) 

enter image description here

Totaquine answered 6/10, 2015 at 16:30 Comment(0)

© 2022 - 2024 — McMap. All rights reserved.