Increasing pie chart size with matplotlib, radius parameter appears to do nothing
Asked Answered
C

2

14

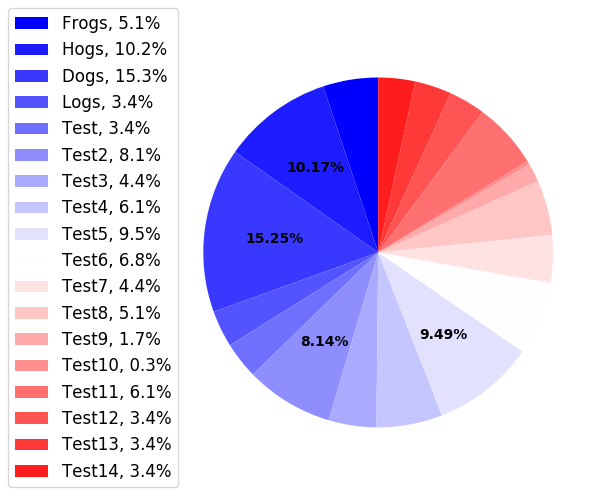
Trying to make the pie larger. Looking at the docs, and other places, it says to set the radius. It seems no matter which value I put in the radius there's no increase. I'm posting the full code and the image it generates.

import matplotlib.pyplot as plt


def autopct_generator(limit):
    """Remove percent on small slices."""
    def inner_autopct(pct):
        return ('%.2f%%' % pct) if pct > limit else ''
    return inner_autopct

labels = 'Frogs', 'Hogs', 'Dogs', 'Logs', 'Test', 'Test2', 'Test3', \
    'Test4', 'Test5', 'Test6', 'Test7', 'Test8', 'Test9', 'Test10', \
    'Test11', 'Test12', 'Test13', 'Test14'
sizes = [15, 30, 45, 10, 10, 24, 13, 18, 28, 20, 13, 15, 5, 1, 18, 10,
         10, 10]
NUM_COLORS = len(sizes)

fig1, ax1 = plt.subplots(figsize=(6, 5))

# set color theme
# https://matplotlib.org/api/pyplot_summary.html#colors-in-matplotlib
theme = plt.get_cmap('bwr')
ax1.set_color_cycle([theme(
    1. * i / NUM_COLORS) for i in range(NUM_COLORS)])

box = ax1.get_position()
ax1.set_position([box.x0, box.y0, box.width * 1.3, box.height])

_, _, autotexts = ax1.pie(
    sizes, autopct=autopct_generator(7), startangle=90, radius=1.8 * 1000)
for autotext in autotexts:
    autotext.set_weight('bold')
ax1.axis('equal')
total = sum(sizes)
plt.legend(
    loc='upper left',
    labels=['%s, %1.1f%%' % (
        l, (float(s) / total) * 100) for l, s in zip(labels, sizes)],
    prop={'size': 12},
    bbox_to_anchor=(0.0, 1),
    bbox_transform=fig1.transFigure
)
# fig1.set_size_inches(18.5, 10.5)
fig1.savefig('chart.png')

enter image description here

Carminecarmita answered 9/3, 2018 at 17:32 Comment(0)
S
14

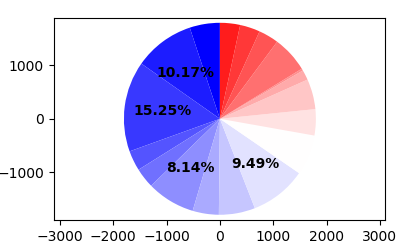
If you turn on the axes of the pie chart,

ax.pie(..., radius=1800, frame=True)

you'll see that the radius is indeed applied correctly.

enter image description here

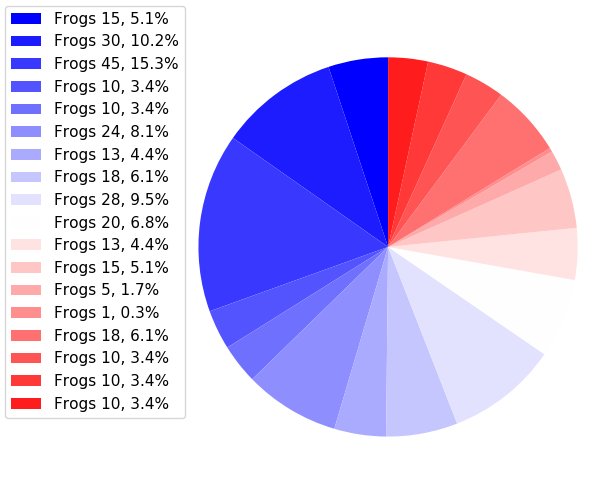
If you want to let the axes appear larger in the plot, you may use the subplot parameters.

fig.subplots_adjust(left,bottom,right,top)

Example code:

import matplotlib.pyplot as plt

sizes = [15, 30, 45, 10, 10, 24, 13, 18, 28, 20, 13, 15, 5, 1, 18, 10,
         10, 10]
labels = ["Frogs %s" % i for i in sizes]

fig1, ax1 = plt.subplots(figsize=(6, 5))
fig1.subplots_adjust(0.3,0,1,1)


theme = plt.get_cmap('bwr')
ax1.set_prop_cycle("color", [theme(1. * i / len(sizes)) for i in range(len(sizes))])

_, _ = ax1.pie(sizes, startangle=90)

ax1.axis('equal')

total = sum(sizes)
plt.legend(
    loc='upper left',
    labels=['%s, %1.1f%%' % (
        l, (float(s) / total) * 100) for l, s in zip(labels, sizes)],
    prop={'size': 11},
    bbox_to_anchor=(0.0, 1),
    bbox_transform=fig1.transFigure
)

plt.show()

enter image description here

Sproul answered 9/3, 2018 at 17:50 Comment(1)
Just to give an idea of the Size of pie chart, in pylab , default radius = 1.Brooking
P
1

Do not set ax1.axis('equal') or ax.pie(..., frame=True), as the given radius represents the ratio between the actual size of the pie chart and 0.8 times the minimum of the width and height of the axes.

This behavior is defined in the Matplotlib source code here.

self.set(frame_on=False, xticks=[], yticks=[],
    xlim=(-1.25 + center[0], 1.25 + center[0]),
    ylim=(-1.25 + center[1], 1.25 + center[1]))

Thus, we can use the below code to get a pie chart given the actual size in inches:

import matplotlib.pyplot as plt

PIE_SIZE = 4 # inches

FIGURE_WIDTH = 6
FIGURE_HEIGHT = 4
def autopct_generator(limit):
    """Remove percent on small slices."""
    def inner_autopct(pct):
        return ('%.2f%%' % pct) if pct > limit else ''
    return inner_autopct

labels = [
    'Frogs', 'Hogs', 'Dogs', 'Logs', 'Test', 'Test2', 'Test3',
    'Test4', 'Test5', 'Test6', 'Test7', 'Test8', 'Test9', 'Test10',
    'Test11', 'Test12', 'Test13', 'Test14'
]
sizes = [
    15, 30, 45, 10, 10, 24, 13, 18, 28, 20, 13, 15, 5, 1, 18, 10, 10, 10
]
NUM_COLORS = len(sizes)
fig1, ax1 = plt.subplots(figsize=(FIGURE_WIDTH, FIGURE_HEIGHT),
    gridspec_kw={'left': .33333, 'right': 1.0, 'top': 1.0, 'bottom': 0.0})

# Get the minimum value of width and height of the axes.
box = ax1.get_position(original=True)
AXES_RADIUS = min(box.width * FIGURE_WIDTH, box.height * FIGURE_HEIGHT)

# set color theme
# https://matplotlib.org/api/pyplot_summary.html#colors-in-matplotlib
theme = plt.get_cmap('bwr')
ax1.set_prop_cycle('color', [theme(
    1. * i / NUM_COLORS) for i in range(NUM_COLORS)])

_, _, autotexts = ax1.pie(
    sizes, autopct=autopct_generator(7), startangle=90,
    radius= PIE_SIZE / (AXES_RADIUS*0.8)
)
for autotext in autotexts:
    autotext.set_weight('bold')
# ax1.axis('equal')
total = sum(sizes)
plt.legend(
    loc='upper left',
    labels=['%s, %1.1f%%' % (
        l, (float(s) / total) * 100) for l, s in zip(labels, sizes)],
    prop={'size': 12},
    bbox_to_anchor=(0.0, 1),
    bbox_transform=fig1.transFigure
)
ax1.axhline(0, color='gray', linestyle='--', linewidth=0.5)
ax1.axvline(0, color='gray', linestyle='--', linewidth=0.5)
fig1.savefig(f'chart{PIE_SIZE}.png')

Figure layout: 1

PIE SIZE = 2 inches: 2

PIE SIZE = 3 inches: 3

PIE SIZE = 4 inches 4

Punjabi answered 6/7 at 5:38 Comment(0)

© 2022 - 2024 — McMap. All rights reserved.