How to set same scales across different facets with ggpairs()
Asked Answered
A

3

14

I have the following dataset and codes to construct the 2d density contour plot for each pair of variables in the data frame. My question is whether there is a way in ggpairs() to make sure that the scales are the same for different pairs of variables like the same scale for different facets in ggplot2. For example, I would like the x scale and y scale are all from [-1, 1] for each of the picture.

Thanks in advance!

The plot looks like enter image description here

library(GGally)
ggpairs(df,upper = list(continuous = "density"),
     lower = list(combo = "facetdensity"))

#the dataset looks like 
print(df)
         x           y           z             w
1   0.49916998 -0.07439680  0.37731097  0.0927331640
2   0.25281542 -1.35130718  1.02680343  0.8462638556
3   0.50950876 -0.22157249 -0.71134553 -0.6137126948
4   0.28740609 -0.17460743 -0.62504812 -0.7658094835
5   0.28220492 -0.47080289 -0.33799637 -0.7032576540
6  -0.06108038 -0.49756810  0.49099505  0.5606988283
7   0.29427440 -1.14998030  0.89409384  0.5656682378
8  -0.37378096 -1.37798177  1.22424964  1.0976507702
9   0.24306941 -0.41519951  0.17502049 -0.1261603208
10  0.45686871 -0.08291032  0.75929106  0.7457002259
11 -0.16567173 -1.16855088  0.59439600  0.6410396945
12  0.22274809 -0.19632766  0.27193362  0.5532901113
13  1.25555629  0.24633499 -0.39836999 -0.5945792966
14  1.30440121  0.05595755  1.04363679  0.7379212885
15 -0.53739075 -0.01977930  0.22634275  0.4699563173
16  0.17740551 -0.56039760 -0.03278126 -0.0002523205
17  1.02873716  0.05929581 -0.74931661 -0.8830775310
18 -0.13417946 -0.60421101 -0.24532606 -0.1951831558
19  0.11552305 -0.14462104  0.28545703 -0.2527437818
20  0.71783902 -0.12285529  1.23488185  1.3224880574
Alcaic answered 8/6, 2015 at 23:1 Comment(0)
L
10

I found a way to do this within ggpairs which uses a custom function to create the graphs

df <- read.table("test.txt")

upperfun <- function(data,mapping){
  ggplot(data = data, mapping = mapping)+
    geom_density2d()+
    scale_x_continuous(limits = c(-1.5,1.5))+
    scale_y_continuous(limits = c(-1.5,1.5))
}   

lowerfun <- function(data,mapping){
  ggplot(data = data, mapping = mapping)+
    geom_point()+
    scale_x_continuous(limits = c(-1.5,1.5))+
    scale_y_continuous(limits = c(-1.5,1.5))
}  


ggpairs(df,upper = list(continuous = wrap(upperfun)),
        lower = list(continuous = wrap(lowerfun)))      # Note: lower = continuous

With this kind of function it is as customizable as any ggplot!

Graph

Lombroso answered 19/4, 2018 at 19:57 Comment(6)
I think this should be the accepted answer now as it is more general and provides a solution within ggpairs() directly.Conrado
Please note that, as in the other solution, the x-scales of the density plots do not agree with the lower diagonal.Hemichordate
To fix the x-scale of the diagonal, you could go in a similar way and create a function diagfun based on the source code for GGally::ggally_densityDiag and add scale_x_continuous(limits = c(-1.5,1.5)) in it. And then use additionally ggparis(diag = )Hemichordate
Another approach to fix the x-scale of the diagonal is to modify the plotmatrix after it has been created: ggpairs() + scale_x_continuous(limits = c(-1.5,1.5)). Actually, the whole question could have been solved as ggpairs() + scale_x_continuous(limits = c(-1.5,1.5)) + scale_y_continuous(limits = c(-1.5,1.5)) if one doesn't care too much about about the y-axis of the density plots.Hemichordate
@Hemichordate good point. I tried adding a fun for diag but it did not seem to work. Would be interested to see if you are successful. Maybe add a new answer?Lombroso
@see24, I just posted another answer with an MWE for that approach.Hemichordate
C
5

I'm not sure whether this is possible from the ggpairs function directly but you can extract a plot from ggpairs and modify it and then save it back.

This example loops over the lower triangle of the matrix of plots and replaces the existing x and y axis scales.

data(tips, package = "reshape")
## pm is the original ggpair object
pm <- ggpairs(tips[,c("total_bill", "tip", "size")])
## pm2 will be modified in the loop
pm2 <- pm
for(i in 2:pm$nrow) {
  for(j in 1:(i-1)) {
    pm2[i,j] <- pm[i,j] +
      scale_x_continuous(limits = c(-5, 75)) +
      scale_y_continuous(limits = c(-5, 10))
}
}

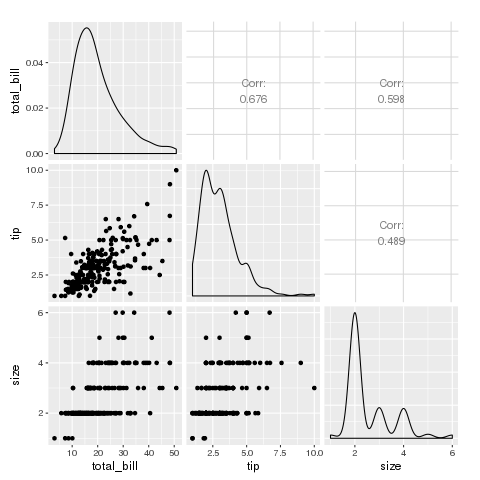
pm looks like this

enter image description here

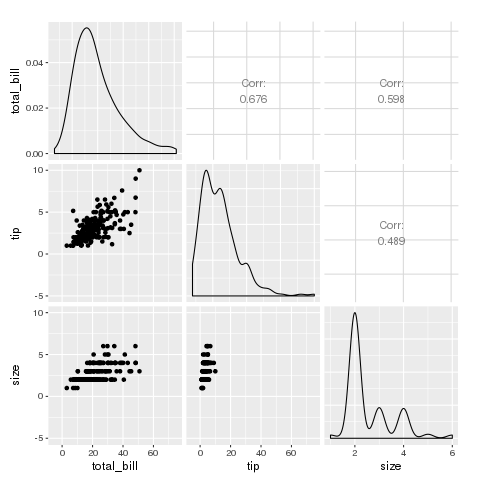
and pm2 looks like this

enter image description here

To solve your problem, you'd loop over the entire matrix of plots and set the x and y scales to have limits of -1 to 1.

EDIT: Note that densities are unchanged as they are still on the original scale so be very careful with this approach of modifying some plots by hand as result could be misleading. I prefer the alternative approach using custom functions in ggpairs.

Conrado answered 14/4, 2016 at 20:45 Comment(0)
H
2

Based on the answer from @see24, I noticed that the x-axis of the diagonal density plots is off. This can be mitigated in two different ways:

  1. by additionally defining a function diagfun for the diagonal elements of the ggpairs output.
  2. in case one doesn't care too much about the vertical axis of the density plots, one can simply add scale_x_continuous(...) and scale_y_continuous(limits = c(-1.5,1.5)) globally to the ggpairs() output.

Method 1

library(GGally)
#> Loading required package: ggplot2
#> Registered S3 method overwritten by 'GGally':
#>   method from   
#>   +.gg   ggplot2
df <- read.table(text = 
"         x           y           z             w
1   0.49916998 -0.07439680  0.37731097  0.0927331640
2   0.25281542 -1.35130718  1.02680343  0.8462638556
3   0.50950876 -0.22157249 -0.71134553 -0.6137126948
4   0.28740609 -0.17460743 -0.62504812 -0.7658094835
5   0.28220492 -0.47080289 -0.33799637 -0.7032576540
6  -0.06108038 -0.49756810  0.49099505  0.5606988283
7   0.29427440 -1.14998030  0.89409384  0.5656682378
8  -0.37378096 -1.37798177  1.22424964  1.0976507702
9   0.24306941 -0.41519951  0.17502049 -0.1261603208
10  0.45686871 -0.08291032  0.75929106  0.7457002259
11 -0.16567173 -1.16855088  0.59439600  0.6410396945
12  0.22274809 -0.19632766  0.27193362  0.5532901113
13  1.25555629  0.24633499 -0.39836999 -0.5945792966
14  1.30440121  0.05595755  1.04363679  0.7379212885
15 -0.53739075 -0.01977930  0.22634275  0.4699563173
16  0.17740551 -0.56039760 -0.03278126 -0.0002523205
17  1.02873716  0.05929581 -0.74931661 -0.8830775310
18 -0.13417946 -0.60421101 -0.24532606 -0.1951831558
19  0.11552305 -0.14462104  0.28545703 -0.2527437818
20  0.71783902 -0.12285529  1.23488185  1.3224880574")

upperfun <- function(data,mapping){
  ggplot(data = data, mapping = mapping)+
    geom_density2d()+
    scale_x_continuous(limits = c(-1.5,1.5))+
    scale_y_continuous(limits = c(-1.5,1.5))
}   
lowerfun <- function(data,mapping){
  ggplot(data = data, mapping = mapping)+
    geom_point()+
    scale_x_continuous(limits = c(-1.5,1.5))+
    scale_y_continuous(limits = c(-1.5,1.5))
}  
diagfun <- function (data, mapping, ..., rescale = FALSE){
  # code based on GGally::ggally_densityDiag
  mapping <- mapping_color_to_fill(mapping)
  p <- ggplot(data, mapping) + scale_y_continuous()
  if (identical(rescale, TRUE)) {
    p <- p + stat_density(aes(y = ..scaled.. * 
                                diff(range(x,na.rm = TRUE)) +
                                min(x, na.rm = TRUE)), 
                          position = "identity", 
                          geom = "line", 
                          ...)
  } else {
    p <- p + geom_density(...)
  }
  p +
    scale_x_continuous(limits = c(-1.5,1.5)) #+
    # scale_y_continuous(limits = c(-1.5,1.5))
}
ggpairs(df,
        upper = list(continuous = wrap(upperfun)),
        diag = list(continuous = wrap(diagfun)),        # Note: lower = continuous
        lower = list(continuous = wrap(lowerfun)))      # Note: lower = continuous

Created on 2022-01-13 by the reprex package (v2.0.1)

Method 2

  library(GGally)
#> Loading required package: ggplot2
#> Registered S3 method overwritten by 'GGally':
#>   method from   
#>   +.gg   ggplot2
  df <- read.table(text = 
                     "         x           y           z             w
1   0.49916998 -0.07439680  0.37731097  0.0927331640
2   0.25281542 -1.35130718  1.02680343  0.8462638556
3   0.50950876 -0.22157249 -0.71134553 -0.6137126948
4   0.28740609 -0.17460743 -0.62504812 -0.7658094835
5   0.28220492 -0.47080289 -0.33799637 -0.7032576540
6  -0.06108038 -0.49756810  0.49099505  0.5606988283
7   0.29427440 -1.14998030  0.89409384  0.5656682378
8  -0.37378096 -1.37798177  1.22424964  1.0976507702
9   0.24306941 -0.41519951  0.17502049 -0.1261603208
10  0.45686871 -0.08291032  0.75929106  0.7457002259
11 -0.16567173 -1.16855088  0.59439600  0.6410396945
12  0.22274809 -0.19632766  0.27193362  0.5532901113
13  1.25555629  0.24633499 -0.39836999 -0.5945792966
14  1.30440121  0.05595755  1.04363679  0.7379212885
15 -0.53739075 -0.01977930  0.22634275  0.4699563173
16  0.17740551 -0.56039760 -0.03278126 -0.0002523205
17  1.02873716  0.05929581 -0.74931661 -0.8830775310
18 -0.13417946 -0.60421101 -0.24532606 -0.1951831558
19  0.11552305 -0.14462104  0.28545703 -0.2527437818
20  0.71783902 -0.12285529  1.23488185  1.3224880574")
  ggpairs(df,
          upper = list(continuous = "density"),
          lower = list(combo = "facetdensity")) +
    scale_x_continuous(limits = c(-1.5,1.5)) +
    scale_y_continuous(limits = c(-1.5,1.5))
#> Scale for 'y' is already present. Adding another scale for 'y', which will
#> replace the existing scale.
#> Scale for 'y' is already present. Adding another scale for 'y', which will
#> replace the existing scale.
#> Scale for 'y' is already present. Adding another scale for 'y', which will
#> replace the existing scale.
#> Scale for 'y' is already present. Adding another scale for 'y', which will
#> replace the existing scale.

Created on 2022-01-13 by the reprex package (v2.0.1)

Hemichordate answered 13/1, 2022 at 13:25 Comment(1)
Method 2 is great! much simpler!Lombroso

© 2022 - 2024 — McMap. All rights reserved.