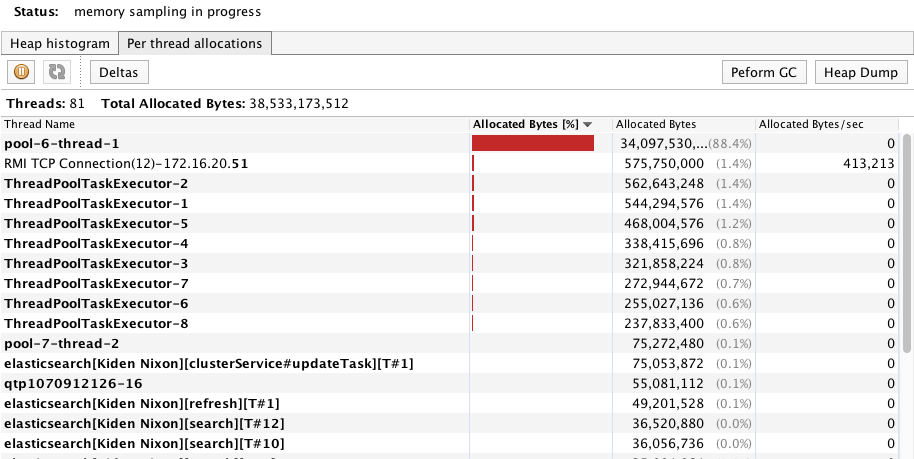
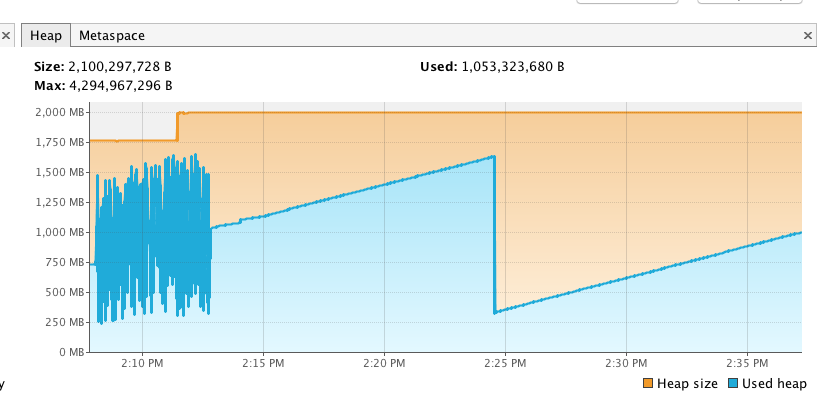
I have an issue I can locate in the profiler but I have no clue how to fix it. After I load the application I get this sawtooth wave pattern, the program is idle but consume memory, as you may see here.
When I checked the sampler thread memory allocations I saw that RMI TCP Connection to my eth0 (172.16.20.51) consumes memory at half a megabyte per second (413,213) which results in production to log 'stop the world' GC :-(
 I could not track the reason of this issue as I don't know which port it is of which thread it is, on the other hand I tried to run my jar with
-com.sun.management.jmxremote.authenticate=false
-Dcom.sun.management.jmxremote.ssl=false
flags but it was not helpful.
Any idea will be appreciated.

