Can we plot image data in Altair?
Asked Answered
C

2

14

I am trying to plot image data in altair, specifically trying to replicate face recognition example in this link from Jake VDP's book - https://jakevdp.github.io/PythonDataScienceHandbook/05.07-support-vector-machines.html.

Any one had luck plotting image data in altair?

Cacodyl answered 1/2, 2020 at 16:43 Comment(0)
W
18

Altair features an image mark that can be used if you want to plot images that are available at a URL; for example:

import altair as alt
import pandas as pd

source = pd.DataFrame.from_records([
      {"x": 0.5, "y": 0.5, "img": "https://vega.github.io/vega-datasets/data/ffox.png"},
      {"x": 1.5, "y": 1.5, "img": "https://vega.github.io/vega-datasets/data/gimp.png"},
      {"x": 2.5, "y": 2.5, "img": "https://vega.github.io/vega-datasets/data/7zip.png"}
])

alt.Chart(source).mark_image(
    width=50,
    height=50
).encode(
    x='x',
    y='y',
    url='img'
)

enter image description here

Altair is not as well suited to displaying 2-dimensional data arrays as images, because the grammar is primarily designed to work with structured tabular data. However, it is possible to do using a combination of flatten transforms and window transforms.

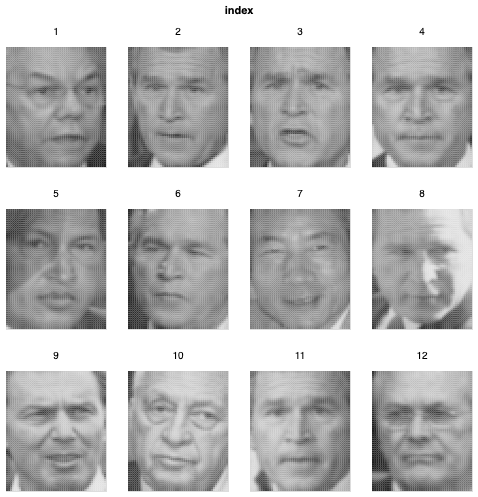
Here is an example using the data from the page you linked to:

import altair as alt
import pandas as pd
from sklearn.datasets import fetch_lfw_people
faces = fetch_lfw_people(min_faces_per_person=60)

data = pd.DataFrame({
    'image': list(faces.images[:12])  # list of 2D arrays
})

alt.Chart(data).transform_window(
    index='count()'           # number each of the images
).transform_flatten(
    ['image']                 # extract rows from each image
).transform_window(
    row='count()',            # number the rows...
    groupby=['index']         # ...within each image
).transform_flatten(
    ['image']                 # extract the values from each row
).transform_window(
    column='count()',         # number the columns...
    groupby=['index', 'row']  # ...within each row & image
).mark_rect().encode(
    alt.X('column:O', axis=None),
    alt.Y('row:O', axis=None),
    alt.Color('image:Q',
        scale=alt.Scale(scheme=alt.SchemeParams('greys', extent=[1, 0])),
        legend=None
    ),
    alt.Facet('index:N', columns=4)
).properties(
    width=100,
    height=120
)

enter image description here

Wisconsin answered 1/2, 2020 at 21:54 Comment(2)
Thank you @jakevdp. You and your books are amazing. Can we expect new features in altair-viz that will allow us to visualize data straight from numpy arrays without having to convert it into pandas dataframe or are we going to have to rely on matplotlib for a long time?Cacodyl
No, Altair's grammar is tied very closely to structured, tabular data. I don't anticipate ever supporting data specified as unlabeled multidimensional arrays.Wisconsin
S
0

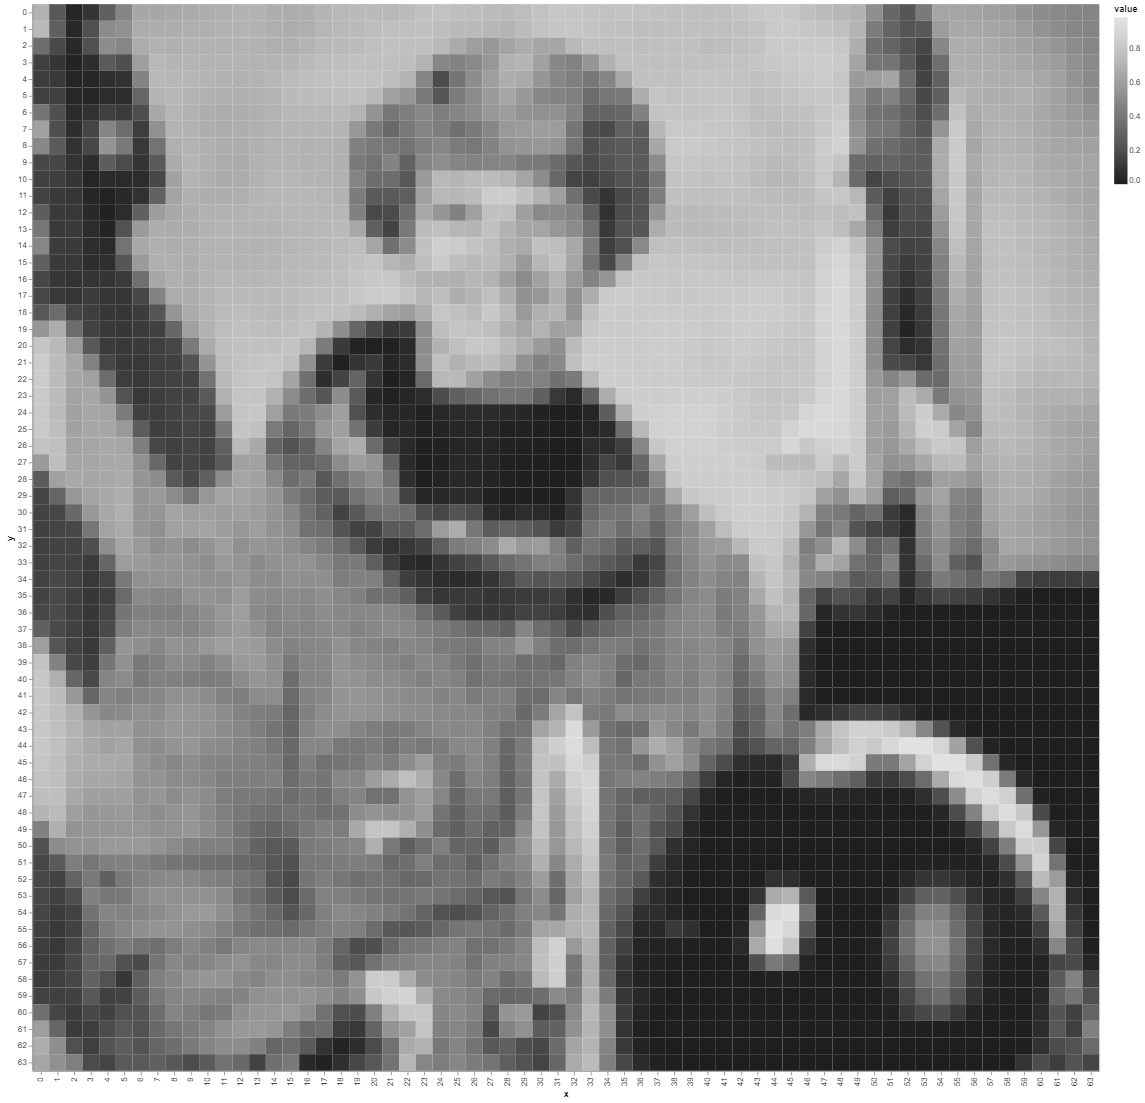
Let's plot a resized small version of the scikit-image's astronaut image with altair (it seems altair can't plot large images):

from skimage.data import astronaut
from skimage.color import rgb2gray
from skimage.transform import resize
import numpy as np
import pandas as pd

im = resize(rgb2gray(astronaut()), (64,64))    
x, y = np.meshgrid(np.arange(im.shape[1]), np.arange(im.shape[0]))

df = pd.DataFrame.from_records(np.reshape(im, (-1,1)))
df.columns = ['value']
df['x'] = x.flatten()
df['y'] = y.flatten()
print(df.shape)
# (4096, 3)
df.head()
#   value       x   y
#0  0.692740    0   0
#1  0.247521    1   0
#2  0.030895    2   0
#3  0.096764    3   0
#4  0.282785    4   0

alt.Chart(df).mark_rect().encode(
    x='x:O',
    y='y:O',
    color=alt.Color('value:Q',
      scale=alt.Scale(scheme=alt.SchemeParams('greys', extent=[1, 0])))
)

with the following output:

enter image description here

whereas with matplotlib.pylab's imshow() here is the original image plot:

import matplotlib.pylab as plt
plt.gray()
plt.imshow(rgb2gray(astronaut()))

enter image description here

Salad answered 30/5, 2023 at 23:10 Comment(0)

© 2022 - 2024 — McMap. All rights reserved.