nls troubles: Missing value or an infinity produced when evaluating the model
Asked Answered
D

3

14

I am an R newbie trying to fit plant photosynthetic light response curves (saturating, curvilinear) to a particular model accepted by experts. The goal is to get estimated coefficient values for Am, Rd, and LCP. Here is the error I keep getting:

Error in numericDeriv(form[[3L]], names(ind), env) : Missing value or an infinity produced when evaluating the model

I have switched around the starting values a number of times, but still no luck. Help? Thanks you in advance. Example dataset below.

photolrc= c(3.089753, 6.336478, 7.737142, 8.004812, 8.031599)
PARlrc= c(48.69624, 200.08539, 499.29840, 749.59222, 1250.09363)
curvelrc<-data.frame(PARlrc,photolrc)
curve.nlslrc = nls(photolrc ~ Am*(1-((1-(Rd/Am))^(1-(PARlrc/LCP)))),start=list(Am=(max(photolrc)-min(photolrc)),Rd=-min(photolrc),LCP= (max(photolrc)-1)))
coef(curve.nlslrc)
Didst answered 21/10, 2015 at 17:18 Comment(2)
nls assumes that all coefficients can take on any value. Right now you have a problem if LCP is equal to zero. If you have restrictions on possible values for these parameters, you should consider re-parameterizing your model.Gerfalcon
I got a similar error if my independent variable took on very large values.Frodine
S
21

minpack.lm to the rescue:

library(minpack.lm)
curve.nlslrc = nlsLM(photolrc ~ Am*(1-((1-(Rd/Am))^(1-(PARlrc/LCP)))),
                   start=list(Am=(max(photolrc)-min(photolrc)),
                              Rd=-min(photolrc),
                              LCP= (max(photolrc)-1)),
                   data = curvelrc)
coef(curve.nlslrc)
  #      Am         Rd        LCP 
  #8.011311   1.087484 -20.752957

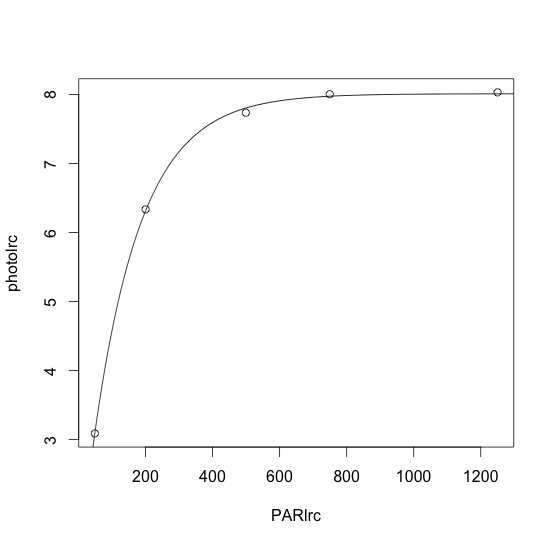
plot(photolrc ~ PARlrc, data = curvelrc)
lines(0:1300, 
      predict(curve.nlslrc, 
              newdata = data.frame(PARlrc = 0:1300)))

resulting plot

If you pass start = list(Am = 8, Rd = 1, LCP = -20) to nls you also get a successful fit.

I don't know if the parameter values are sensible estimates considering the science behind this. Can LCP be negative?

Scarify answered 21/10, 2015 at 17:33 Comment(4)
Thanks @Roland! Unfortunately though, you are correct. LCP mathematically should be the x intercept, but biologically speaking, cannot be negative. Any way that minpack can help me force this parameter to be a positive value?Didst
You can specify lower limits with nls, but I don't think you will have any luck with that. Your data simply doesn't support a positive intersection with the x-axis. Maybe if you had datapoints with lower photolrc values ...Scarify
Having tried a number of nls routines in R (nls, nlmrt and also used optim), I have had by far the best success using minpack.lm.Tuba
but beware of false convergence when using it!Scarify
P
2

The problems are:

  • we need better initial values
  • according to a comment by the poster we need to constrain LCP to be positive.

To do that we can use nls2 to get better starting values followed by using nls with the port algorithm to enforce a lower bound for LCP. Note that LCP hit the constraint boundary.

library(nls2)

# get starting value fit
st <- data.frame(Am = c(1, 10), Rd = c(-10, 10), LCP = c(0.5, 10))
fo <- photolrc ~ Am*(1-((1-(Rd/Am))^(1-(PARlrc/LCP))))
fm2 <- nls2(fo, start = st, alg = "brute")

# nls fit
fm <- nls(fo, start = coef(fm2), lower = c(-Inf, -Inf, 0.1), algorithm = "port")

giving:

> fm
Nonlinear regression model
  model: photolrc ~ Am * (1 - ((1 - (Rd/Am))^(1 - (PARlrc/LCP))))
   data: parent.frame()
       Am        Rd       LCP 
 7.919374 -0.007101  0.100000 
 residual sum-of-squares: 0.1858

Algorithm "port", convergence message: relative convergence (4)
Prodrome answered 3/6, 2020 at 18:3 Comment(0)
Y
-1

Try removing any row observations with zero, especially in the predictor variables and try the nls function. It worked for me.

Yaya answered 2/6, 2020 at 14:58 Comment(0)

© 2022 - 2024 — McMap. All rights reserved.