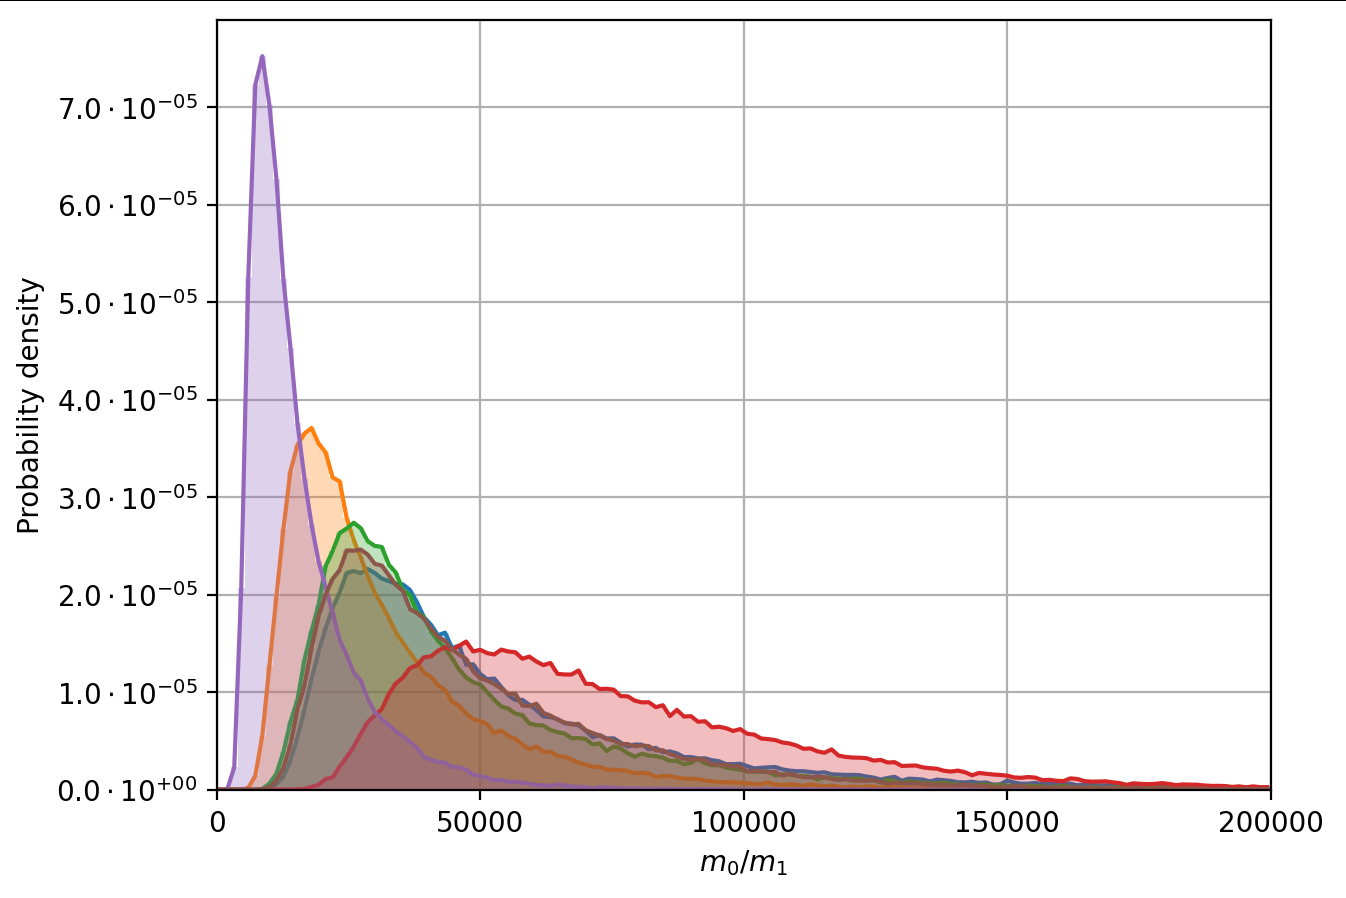
I have an image:

Here in the y-axis I would like to get 5x10^-5 4x10^-5 and so on instead of 0.00005 0.00004.
What I have tried so far is:
fig = plt.figure()
ax = fig.add_subplot(111)
y_formatter = matplotlib.ticker.ScalarFormatter(useOffset=True)
ax.yaxis.set_major_formatter(y_formatter)

ax.plot(m_plot,densities1,'-ro',label='0.0<z<0.5')
ax.plot(m_plot,densities2, '-bo',label='0.5<z<1.0')


ax.legend(loc='best',scatterpoints=1)
plt.legend()
plt.show()
This does not seem to work. The document page for tickers does not seem to provide a direct answer.


%2.2ein your short solution do? – Rosalinarosalind