Reverse order in R leaflet continuous legend
Asked Answered
F

4

14

I am trying to reverse the value display of my leaflet legend in R. This post covers categorical data, but I am working with continuous data. Here's a toy example:

map <- leaflet() %>% addProviderTiles('Esri.WorldTopoMap')
x <- 1:100
pal <- colorNumeric(c("#d7191c","#fdae61","#ffffbf","#abd9e9", "#2c7bb6"), x)
map %>% addLegend('topright', pal=pal, values=x)

I'd like the legend to read 100 at the top and 1 on the bottom with the colors reversed. I can certainly reverse the colors in colorNumeric(), but reversing the order of the labels is harder. I have tried reversing the order of the values in x, and I even fiddled with the labelFormat() parameter for addLegend() to reference a lookup table of reversed values... nothing seems to work. Is there an easy way to do this?

Footlight answered 27/10, 2016 at 5:11 Comment(0)
P
17

Unfortunately the accepted answer to this will get the numbers out of alignment (in fact exactly reversed) from the colours they represent.

Here's the original proposed solution, which I say is incorrect:

map <- leaflet() %>% addProviderTiles('Esri.WorldTopoMap')
x <- 1:100
pal <- colorNumeric(c("#d7191c","#fdae61","#ffffbf","#abd9e9", "#2c7bb6"), x)
map %>% addLegend('topright', pal=pal, values=x)

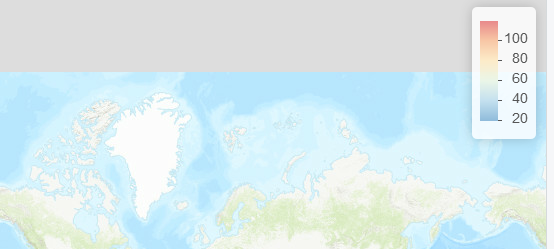
# This solution shows 100 as red
map %>% addLegend('topright',
                  pal = pal, 
                  values = x, 
                  labFormat = labelFormat(transform = function(x) sort(x, decreasing = TRUE)))

enter image description here

But if you've been using the pal() function to draw anything on your map, you now have it exactly wrong.

# But 100 is blue, not red
plot(1, 1, pch = 19, cex = 3, col = pal(100))

enter image description here

I think the solution is to define to functions that allocate colours to numbers, one in reverse for the legend, and one for actually drawing things:

pal_rev <- colorNumeric(c("#d7191c","#fdae61","#ffffbf","#abd9e9", "#2c7bb6"), x, reverse = TRUE)

map %>% addLegend('topright',
                  pal = pal_rev, 
                  values = x, 
                  labFormat = labelFormat(transform = function(x) sort(x, decreasing = TRUE)))

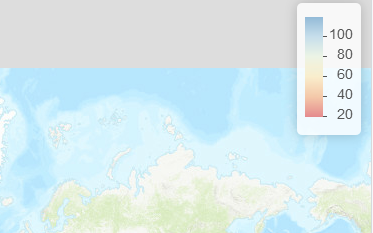
This gives us a legend that matches anything we will have drawn ie 100 is now correctly shown to be blue:

enter image description here

Property answered 28/5, 2019 at 1:59 Comment(0)
B
7

Although the accepted answer does flip the legend's colors and labels, the map's colors do not adress to the legend. Here is a (stolen from here) solution. Basically mpriem89 created a new function called addLegend_decreasing which works exactly like addLegend with an extra argument: decreasing = FALSE that reverses the legend's colors and labels, correctly adressing to the map's colors. Here is the function code:

    addLegend_decreasing <- function (map, position = c("topright", "bottomright", "bottomleft","topleft"),
                                  pal, values, na.label = "NA", bins = 7, colors, 
                                  opacity = 0.5, labels = NULL, labFormat = labelFormat(), 
                                  title = NULL, className = "info legend", layerId = NULL, 
                                  group = NULL, data = getMapData(map), decreasing = FALSE) {
  
        position <- match.arg(position)
        type <- "unknown"
        na.color <- NULL
        extra <- NULL
        if (!missing(pal)) {
            if (!missing(colors)) 
                stop("You must provide either 'pal' or 'colors' (not both)")
            if (missing(title) && inherits(values, "formula")) 
                title <- deparse(values[[2]])
            values <- evalFormula(values, data)
            type <- attr(pal, "colorType", exact = TRUE)
            args <- attr(pal, "colorArgs", exact = TRUE)
            na.color <- args$na.color
            if (!is.null(na.color) && col2rgb(na.color, alpha = TRUE)[[4]] == 
                    0) {
                na.color <- NULL
            }
            if (type != "numeric" && !missing(bins)) 
                warning("'bins' is ignored because the palette type is not numeric")
            if (type == "numeric") {
                cuts <- if (length(bins) == 1) 
                    pretty(values, bins)
                else bins   
                if (length(bins) > 2) 
                    if (!all(abs(diff(bins, differences = 2)) <= 
                                     sqrt(.Machine$double.eps))) 
                        stop("The vector of breaks 'bins' must be equally spaced")
                n <- length(cuts)
                r <- range(values, na.rm = TRUE)
                cuts <- cuts[cuts >= r[1] & cuts <= r[2]]
                n <- length(cuts)
                p <- (cuts - r[1])/(r[2] - r[1])
                extra <- list(p_1 = p[1], p_n = p[n])
                p <- c("", paste0(100 * p, "%"), "")
                if (decreasing == TRUE){
                    colors <- pal(rev(c(r[1], cuts, r[2])))
                    labels <- rev(labFormat(type = "numeric", cuts))
                }else{
                    colors <- pal(c(r[1], cuts, r[2]))
                    labels <- rev(labFormat(type = "numeric", cuts))
                }
                colors <- paste(colors, p, sep = " ", collapse = ", ")
            }
            else if (type == "bin") {
                cuts <- args$bins
                n <- length(cuts)
                mids <- (cuts[-1] + cuts[-n])/2
                if (decreasing == TRUE){
                    colors <- pal(rev(mids))
                    labels <- rev(labFormat(type = "bin", cuts))
                }else{
                    colors <- pal(mids)
                    labels <- labFormat(type = "bin", cuts)
                }
            }
            else if (type == "quantile") {
                p <- args$probs
                n <- length(p)
                cuts <- quantile(values, probs = p, na.rm = TRUE)
                mids <- quantile(values, probs = (p[-1] + p[-n])/2, na.rm = TRUE)
                if (decreasing == TRUE){
                    colors <- pal(rev(mids))
                    labels <- rev(labFormat(type = "quantile", cuts, p))
                }else{
                    colors <- pal(mids)
                    labels <- labFormat(type = "quantile", cuts, p)
                }
            }
            else if (type == "factor") {
                v <- sort(unique(na.omit(values)))
                colors <- pal(v)
                labels <- labFormat(type = "factor", v)
                if (decreasing == TRUE){
                    colors <- pal(rev(v))
                    labels <- rev(labFormat(type = "factor", v))
                }else{
                    colors <- pal(v)
                    labels <- labFormat(type = "factor", v)
                }
            }
            else stop("Palette function not supported")
            if (!any(is.na(values))) 
                na.color <- NULL
        }
        else {
            if (length(colors) != length(labels)) 
                stop("'colors' and 'labels' must be of the same length")
        }
        legend <- list(colors = I(unname(colors)), labels = I(unname(labels)), 
                                     na_color = na.color, na_label = na.label, opacity = opacity, 
                                     position = position, type = type, title = title, extra = extra, 
                                     layerId = layerId, className = className, group = group)
        invokeMethod(map, data, "addLegend", legend)
        }

Once you've run it, you should replace addLegend with addLegend_decreasing and set decreasing = TRUE. Then, your code changes to:

    #Default map:
    map <- leaflet() %>% addProviderTiles('Esri.WorldTopoMap')
    x <- 1:100
    pal <- colorNumeric(c("#d7191c","#fdae61","#ffffbf","#abd9e9", "#2c7bb6"), x)
    map %>% addLegend_decreasing('topright', pal = pal, values = x, decreasing = TRUE)

Here is an example for a real leaflet map:

    df <- local({
    n <- 300; x <- rnorm(n); y <- rnorm(n)
    z <- sqrt(x ^ 2 + y ^ 2); z[sample(n, 10)] <- NA
    data.frame(x, y, z)
    })
    pal <- colorNumeric("OrRd", df$z)
    leaflet(df) %>%
      addTiles() %>%
        addCircleMarkers(~x, ~y, color = ~pal(z), group = "circles") %>%
          addLegend(pal = pal, values = ~z, group = "circles", position = "bottomleft") %>%
            addLayersControl(overlayGroups = c("circles"))

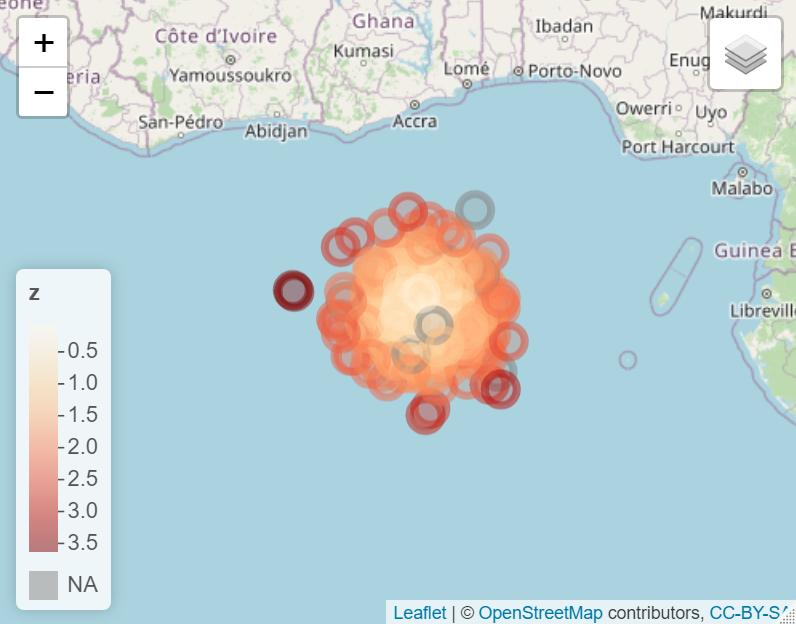
Map with default addLegend:

enter image description here

Same map with addLegend_decreasing and decreasing = TRUE

    leaflet(df) %>%
      addTiles() %>%
        addCircleMarkers(~x, ~y, color = ~pal(z), group = "circles") %>%
          addLegend_decreasing(pal = pal, values = ~z, group = "circles", position = "bottomleft", decreasing = TRUE) %>%
            addLayersControl(overlayGroups = c("circles"))

Map with custom addLegend_decreasing:

enter image description here

Hope this helps, it certainly helped me.

Butternut answered 19/3, 2021 at 15:57 Comment(1)
Great job, this was driving me mad. Thanks for the solution!Teakettle
F
6

I just found that the built-in labelFormat function has a transform parameter that takes a function. So I passed the sort function in there. To use the same example,

map %>% addLegend('topright',
              pal = pal, 
              values = x, 
              labFormat = labelFormat(transform = function(x) sort(x, decreasing = TRUE)))
Fiesta answered 5/12, 2017 at 6:8 Comment(1)
Unless I'm very much mistaken the legend that comes out of this has reversed the labels but not the colours, so it is exactly long. You can check this with plot(1:10, 1:10, pch = 19, cex = 3, col = pal(100)) which shows that x=100 is turning up as blue, although the legend says it is red.Property
S
0

Here's a solution I came up to reverse the order of the leaflet legend:

pal <- colorNumeric(c("#fdae61", "#2c7bb6", "#abd9e9", "#ffffbf","#d7191c"), x * -1)
map %>% addLegend('topright', pal=pal, values= x * -1, labFormat = labelFormat(transform = function(x) -1 * x))

This will flip both the colors and labels on the map. In this scenario you have to manually reverse the hex code for colors but if you use the colorNumeric() method in leaflet you can avoid this step.

Shout answered 25/7 at 22:29 Comment(0)

© 2022 - 2024 — McMap. All rights reserved.