This question is related to this one from SO (matplotlib-change-colormap-tab20-to-have-three-colors)
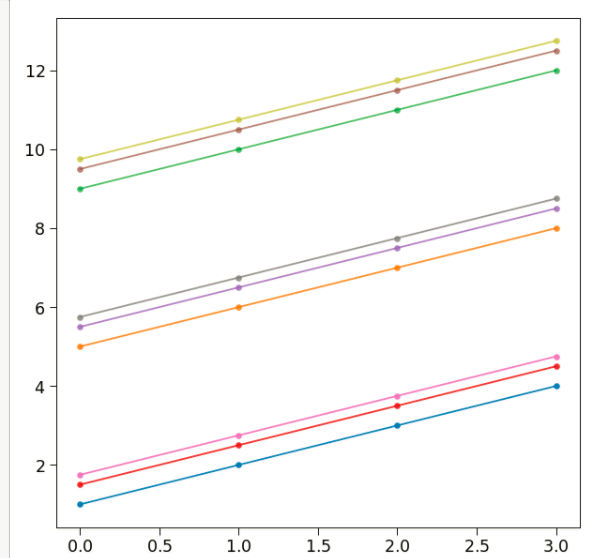
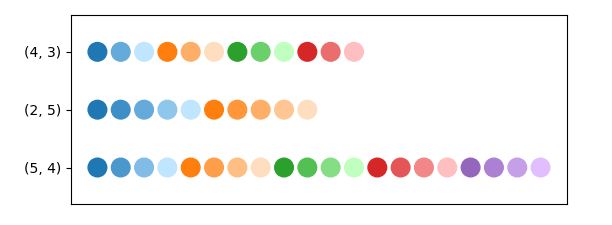
I would like to tweak the tab10 colormap in a way that I can change the alpha level of each color in as many steps as I would like to. Below is an example (for 9 color with 3 alpha levels) which does not yield the expected output. Furthermore, it is not generic enough (because of the if elif staements).
Any ideas how I could do that ?
In this example, I do have 3 groups with 3 subgroups:
import pandas as pd
from matplotlib import pyplot as plt
import numpy as np

n_feature = 3
sub_feature = 3
col = []
for index in range(n_feature*sub_feature):
# loop over colors and change the last entry in descending order 3 times
        col.append(list(plt.cm.tab10(index)))

i = 0
for item in col:
# loop over colors and change the last entry in descending order 3 times
    if i == 0:
        item[-1] = 0.9
        i+=1
    elif i == 1:
        item[-1] = 0.7
        i+=1
    elif i == 2:
        item[-1] = 0.5
        i = 0

gr = df.groupby(['a', 'a1'])

for index, item in enumerate(gr):
    name, val = item
    y = val.iloc[0,2:].values
    x = np.arange(len(y))
    plt.plot(x, y, '.-', color=col[index])

plt.show()
This is the data:
{'a': {0: 'A', 1: 'A', 2: 'A', 3: 'B', 4: 'B', 5: 'B', 6: 'C', 7: 'C', 8: 'C'}, 'a1': {0: 1, 1: 2, 2: 3, 3: 1, 4: 2, 5: 3, 6: 1, 7: 2, 8: 3}, 'b': {0: 1.0, 1: 5.0, 2: 9.0, 3: 1.5, 4: 5.5, 5: 9.5, 6: 1.75, 7: 5.75, 8: 9.75}, 'c': {0: 2.0, 1: 6.0, 2: 10.0, 3: 2.5, 4: 6.5, 5: 10.5, 6: 2.75, 7: 6.75, 8: 10.75}, 'd': {0: 3.0, 1: 7.0, 2: 11.0, 3: 3.5, 4: 7.5, 5: 11.5, 6: 3.75, 7: 7.75, 8: 11.75}, 'e': {0: 4.0, 1: 8.0, 2: 12.0, 3: 4.5, 4: 8.5, 5: 12.5, 6: 4.75, 7: 8.75, 8: 12.75}}


tab10(index)– Minier