How to generate bin frequency table in R?
Asked Answered
H

5

14

How can i bin data of size 0.1 for the following example.

x<-c(0.01,0.34,0.45,0.67,0.89,0.12,0.34,0.45,0.23,0.45,0.34,0.32,0.45,0.21,0.55,0.66,0.99,0.23,.012,0.34)
range        frequency
0.1-0.2       a
0.2-0.3       b
0.3-0.4       c
................
................
................
................

Regards

Historic answered 8/1, 2015 at 11:48 Comment(0)
O
21

Regarding @akrun solution, I would post something usefull from the documentation ?cut, in case:

Note

Instead of table(cut(x, br)), hist(x, br, plot = FALSE) is more efficient and less memory hungry.

So, in case of lots of data, I would rather opt for:

br = seq(0,1,by=0.1)

ranges = paste(head(br,-1), br[-1], sep=" - ")
freq   = hist(x, breaks=br, include.lowest=TRUE, plot=FALSE)

data.frame(range = ranges, frequency = freq$counts)

#       range frequency
#1    0 - 0.1         2
#2  0.1 - 0.2         1
#3  0.2 - 0.3         3
#4  0.3 - 0.4         5
#5  0.4 - 0.5         4
#6  0.5 - 0.6         1
#7  0.6 - 0.7         2
#8  0.7 - 0.8         0
#10   0.9 - 1         1
Ogle answered 11/1, 2015 at 16:10 Comment(2)
freq = hist(x, breaks=br, include.lowest=TRUE, plot=FALSE) #break=br should be breaks=brAromaticity
How would I apply this on all columns of a dataframe, and store the results in new dataframe?Kruse
L
10

try

 as.data.frame(table(cut(x, breaks=seq(0,1, by=0.1)), dnn="Range"))
Leporine answered 8/1, 2015 at 11:50 Comment(0)
P
3

Building on @Colonel Beauvel's answer,

A bin frequency table function. (Histogram table).

binFreqTable <- function(x, bins=5) {
  freq = hist(x, breaks=bins, include.lowest=TRUE, plot=FALSE)
  ranges = paste(head(freq$breaks,-1), freq$breaks[-1], sep=" - ")
  return(data.frame(range = ranges, frequency = freq$counts))
}

Examples:

x <-c(0.01,0.34,0.45,0.67,0.89,0.12,0.34,0.45,0.23,0.45,0.34,0.32,0.45,0.21,0.55,0.66,0.99,0.23,.012,0.34)

binFreqTable(x,c(0,.3,.6,1)) # 3 bins split at 0.3 and 0.6
#      range frequency
#1   0 - 0.3         6
#2 0.3 - 0.6        10
#3   0.6 - 1         4

binFreqTable(x,5) # Split into 5 even bins
#      range frequency
#1   0 - 0.2         3
#2 0.2 - 0.4         8
#3 0.4 - 0.6         5
#4 0.6 - 0.8         2
#5   0.8 - 1         2

binFreqTable(x,seq(0,1,by=0.1)) # Split into 0.1 increments from 0 to 1
#       range frequency
#1    0 - 0.1         2
#2  0.1 - 0.2         1
#3  0.2 - 0.3         3
#4  0.3 - 0.4         5
#5  0.4 - 0.5         4
#6  0.5 - 0.6         1
#7  0.6 - 0.7         2
#8  0.7 - 0.8         0
#9  0.8 - 0.9         1
#10   0.9 - 1         1
Proviso answered 14/5, 2019 at 0:39 Comment(0)
F
1

Akrun's answer was good but didn't quite get me there for formatting.

x<-c(0.01,0.34,0.45,0.67,0.89,0.12,0.34,0.45,0.23,0.45,0.34,0.32,0.45,0.21,0.55,0.66,0.99,0.23,.012,0.34)

cuts<-cut(x, breaks=seq(0,1, by=0.1))
counts<-c(t(table(cuts)))

#Here's the important part for me, formatting the cuts for display in the data frame:

labs <- levels(cuts)
lable_matrix<-cbind(lower = as.numeric( sub("\\((.+),.*", "\\1", labs) ),
  upper = as.numeric( sub("[^,]*,([^]]*)\\]", "\\1", labs) ))

cut_frame<-data.frame(lable_matrix,counts)

#   lower upper counts  
#1    0.0   0.1      2  
#2    0.1   0.2      1  
#3    0.2   0.3      3  
#4    0.3   0.4      5  
#5    0.4   0.5      4  
#6    0.5   0.6      1  
#7    0.6   0.7      2  
#8    0.7   0.8      0  
#9    0.8   0.9      1  
#10   0.9   1.0      1  
Finished answered 18/10, 2017 at 21:6 Comment(0)
F
0

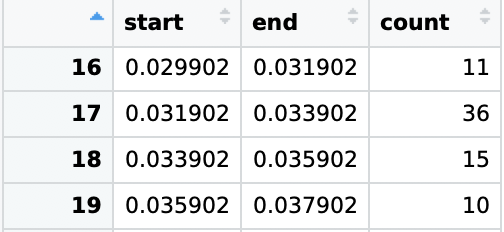
Here's what I did:

x <- sort(x)
start <- min(x)
len <- 0.002
end <- start + len
freq_table <- data.frame(start=c(NA), end=c(NA), count=c(NA))
count <- 0
for (i in (1:length(x))) {
  if (x[i] < end && x[i] >= start) {
    print(c(newdata[i],end))
    count <- count + 1
  } else {
    freq_table <- rbind(freq_table, c(start, end, count))
    i <- i - 1
    count <- 0
    start <- end
    end <- end + len
  }
}

and my output is like this:

enter image description here

Feaster answered 23/4, 2021 at 8:52 Comment(0)

© 2022 - 2024 — McMap. All rights reserved.