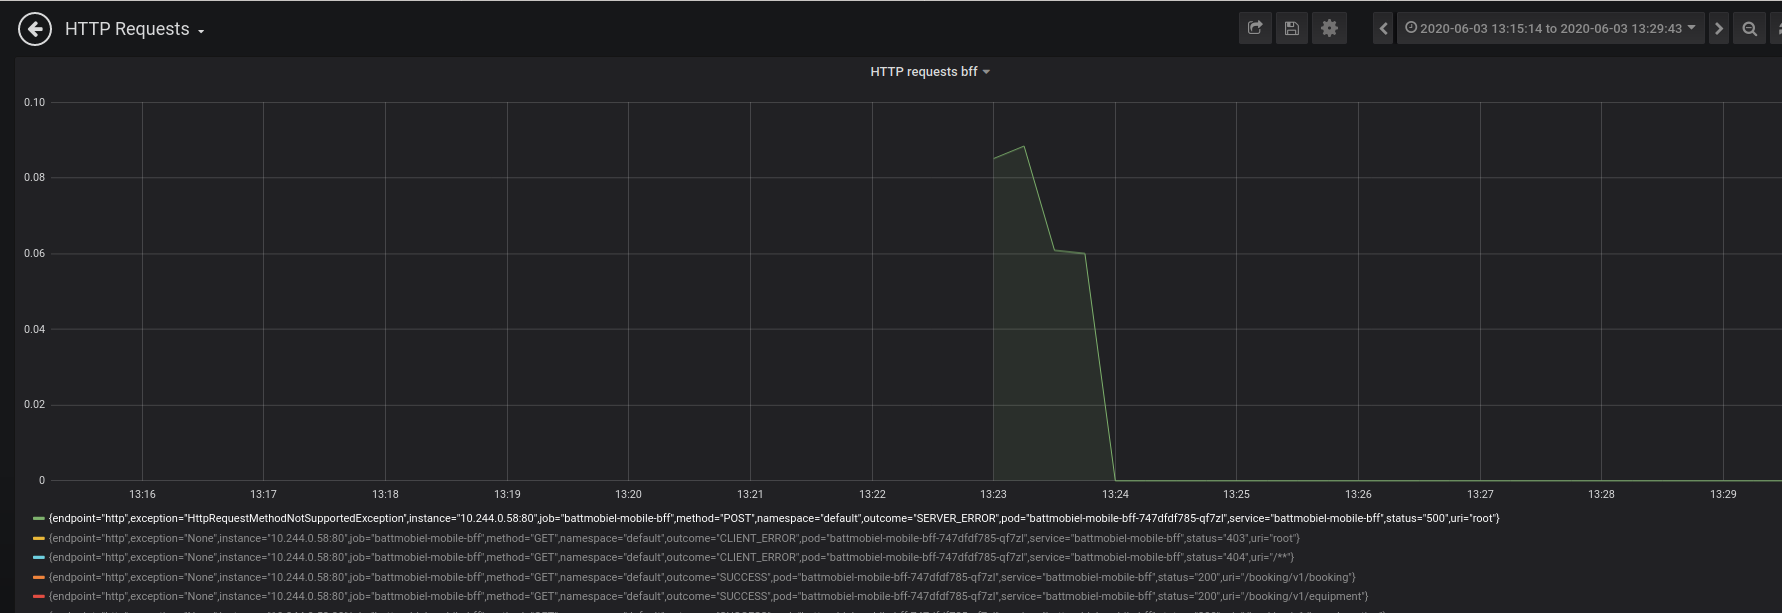
In our Prometheus metrics in our Spring Boot API, there is a very mysterious root "endpoint" that appears to be called sometimes. This looks like someone probing our API, but the endpoint does not exist. The really strange part is that I don't see how this "URI" can even be called, since it doesn't start with a forward slash (/) ? We also see this request in our pod logs, but not in our ingress-controller logs. Where could it come from?

From WebMvcTags always reports "root" as uri when servlet Filter handles the request #17147
In a Spring-MVC Boot app,
http.server.requestsmetrics are always reported with a root uri if the request, which would be mapped to Spring-MVC controller under normal circumstances, is handled by a servlet Filter instead. This happens for example when using Spring Security.
The reason is that theWebMvcTagsuses the path info of the request in these situations, which is always null because theDispatcherServletis mapped as a default servlet: the whole path is then present in the servlet path instead.
The answer from the Spring Boot Team:
The team has discussed this again, and we don't think we can address that problem.
- as explained, taking the servlet path from the request would create an explosion of metrics
- other paths (like a Filter mapping path) won't be useful
- we won't call in the MVC infrastructure to map that request, as it creates security concerns and can be quite involved (CORS support, interceptors)
Also, getting the Controller mapping would not really help. If a request is really slow and the Filter processing the request is at fault, we would report the Controller path pattern and confuse developers about the misbehaving parts of their applications. Maybe the Servlet filter name would be more useful here, but there's no way to get that in the filter chain, and that information would not really map to a uri tag.
As a result, we're closing this issue.
I ran into the same issue with a lot of head scratching. It turns out in my case, @Timing annotations were attached to all of my rest controllers which quietly overrode the default http metrics provided from actuator.
Found a solution. I added a high priority filter, in the filter I forced the URL attribute to be included in the request. Maybe not perfect, but it works
Name of attribute took from the org.springframework.boot.actuate.metrics.web.servlet.WebMvcTags.uri();
Filter class
@AllArgsConstructor
public class MetricHandlingFilter extends OncePerRequestFilter {

@Override
protected void doFilterInternal(HttpServletRequest request, HttpServletResponse response, FilterChain filterChain) throws ServletException, IOException {
    if (request.getAttribute(HandlerMapping.BEST_MATCHING_PATTERN_ATTRIBUTE) == null) {
        request.setAttribute(HandlerMapping.BEST_MATCHING_PATTERN_ATTRIBUTE, request.getRequestURI());
    }
    filterChain.doFilter(request, response);
 }
}
Configuration class
@Configuration
@AllArgsConstructor
public class FilterConfiguration {

private final AutowireCapableBeanFactory beanFactory;

@Bean
public FilterRegistrationBean<MetricHandlingFilter> filterRegistration() {
    MetricHandlingFilter handlingFilter = new MetricHandlingFilter();
    beanFactory.autowireBean(handlingFilter);
    FilterRegistrationBean<MetricHandlingFilter> registrationBean = new FilterRegistrationBean<>(handlingFilter);
    registrationBean.setOrder(Integer.MIN_VALUE); //high priority
    return registrationBean;
 }
}
When principal is not set in security context, Spring security logs uri as root, irrespective of the path the request is fired.
If you have many hits to /root uri and status_code is 401, means you are some API are not passing authentication filter.
© 2022 - 2025 — McMap. All rights reserved.

http_requests_seconds_countwithuri=root. And don't know what that means. It looks like no external user is probing your API, but it is something internal to the application. – Uncharitable