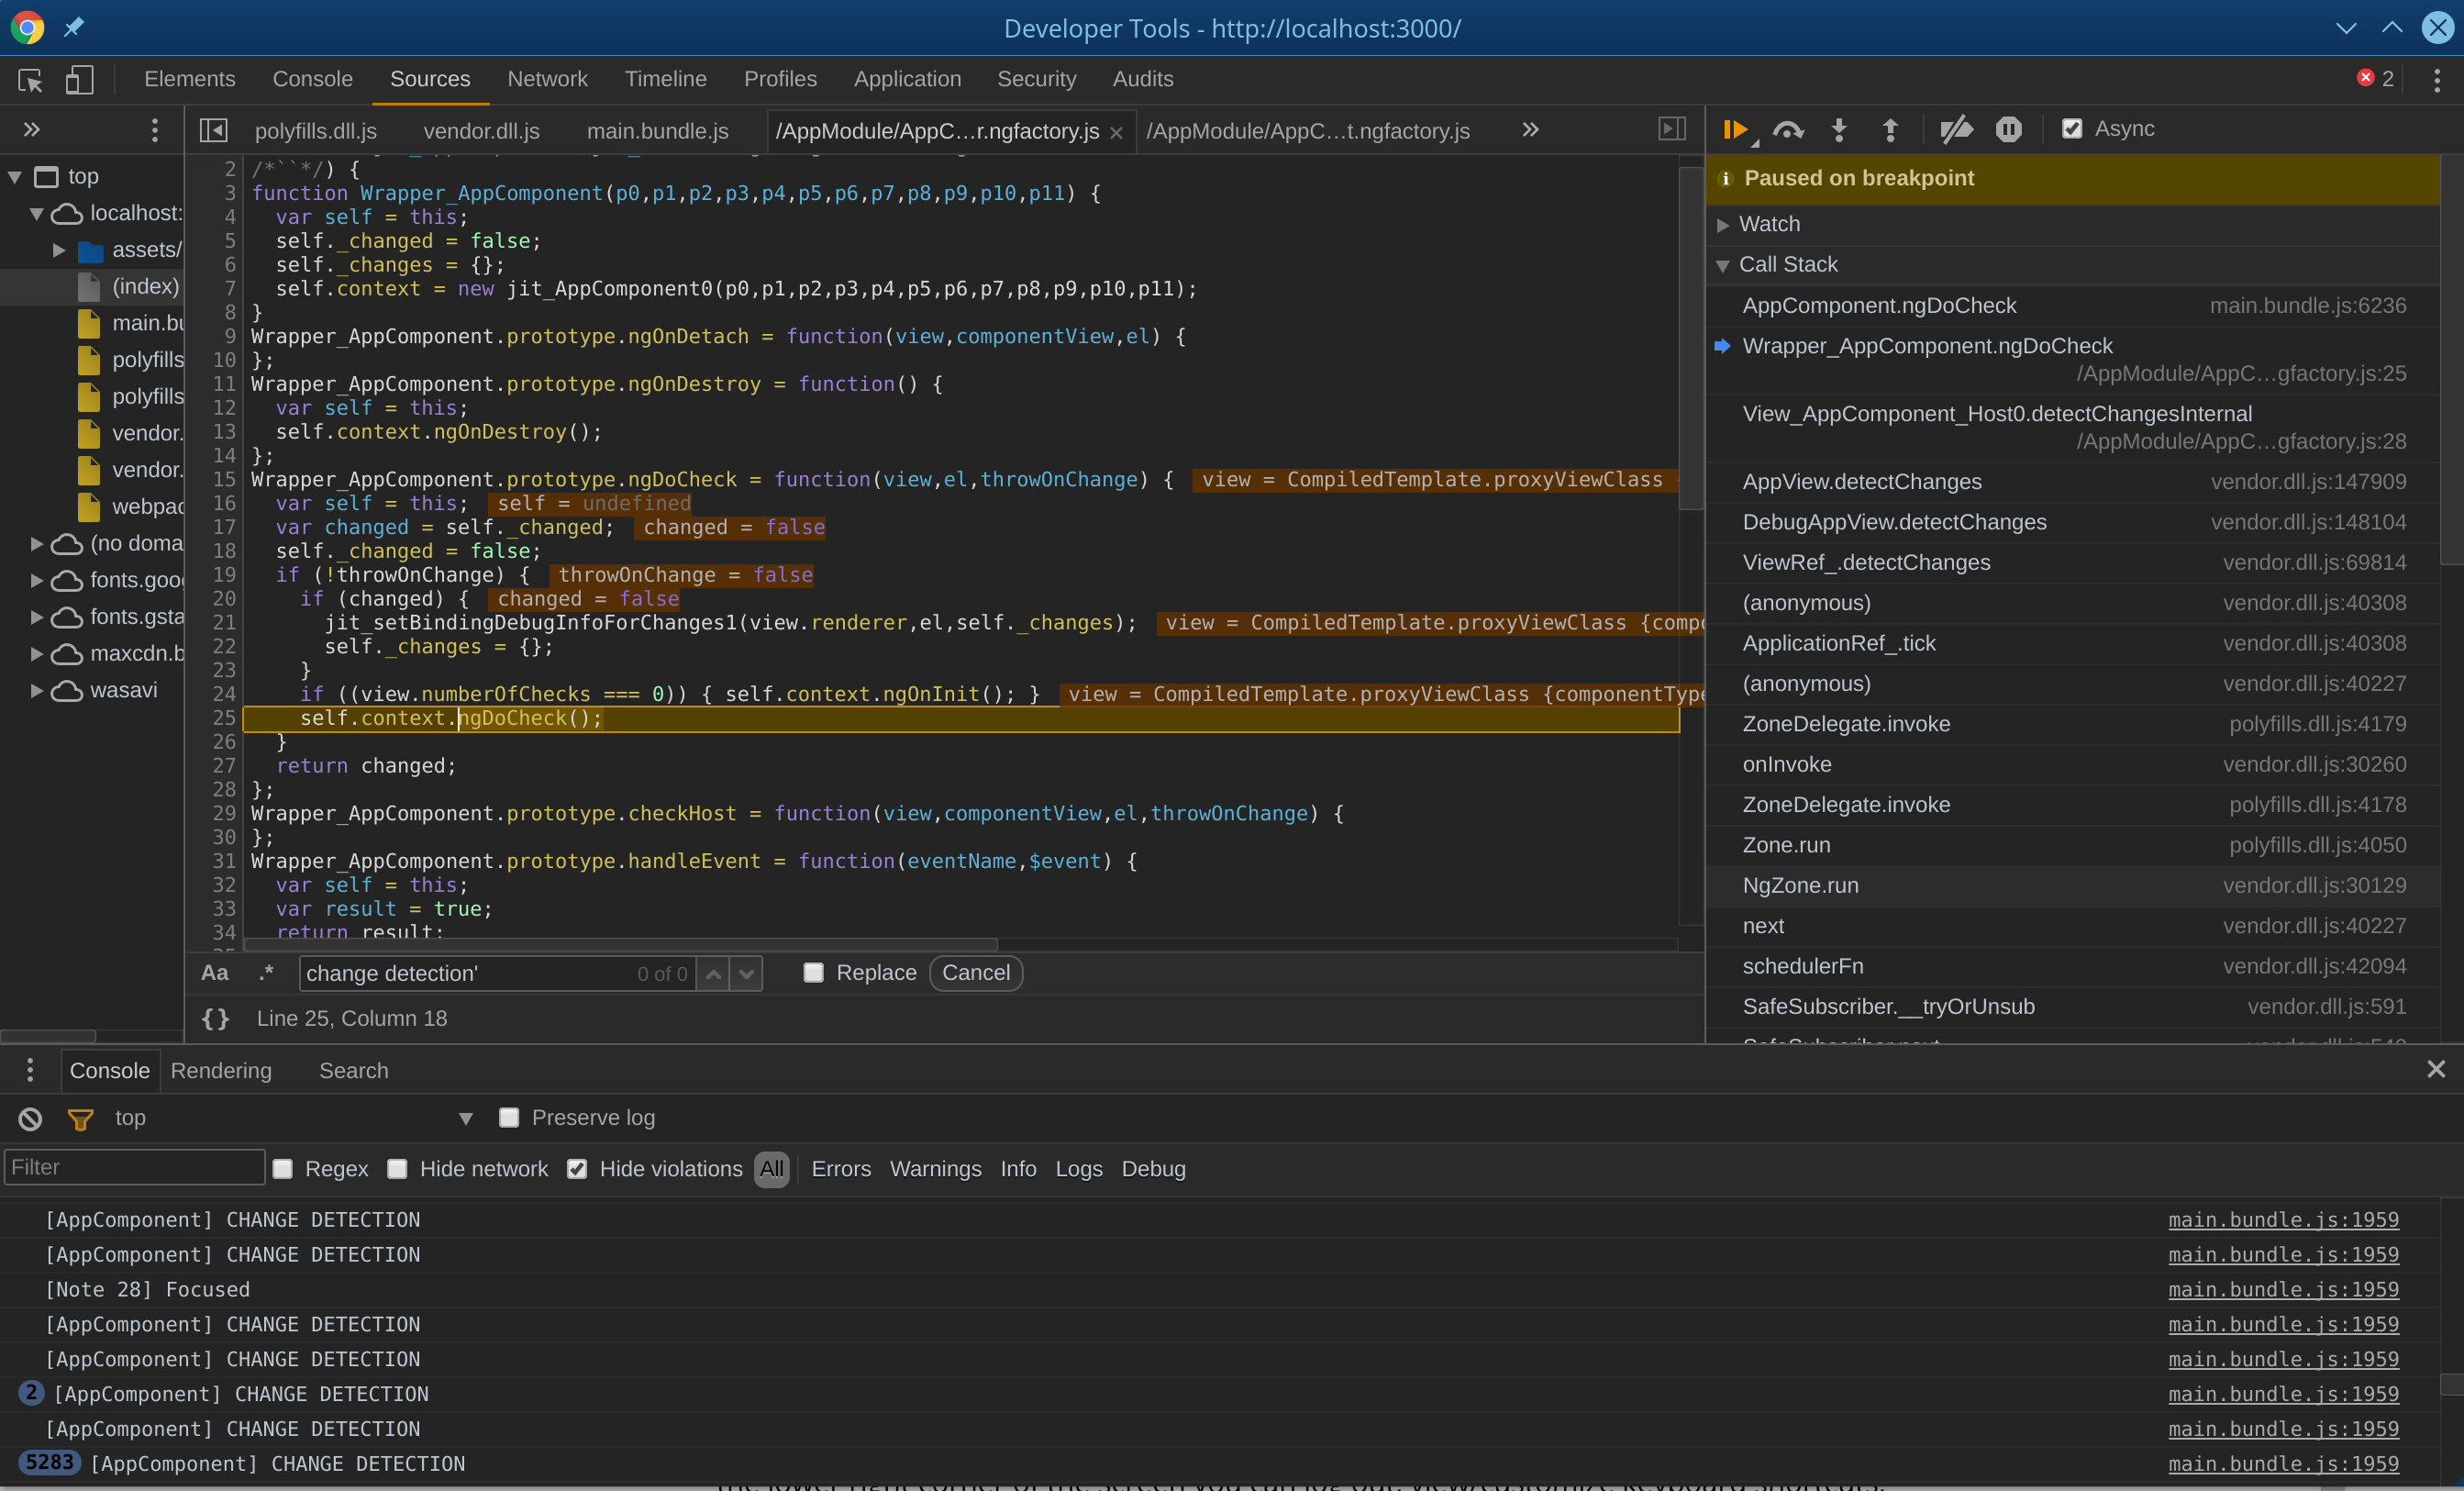
May be a bit late, but still may be helpful for someone.
I found a couple of solution which can help you to find what actually cause a CD cycle.
First one, as was mention in comments is to check the source field of Task, the easiest way is
 // put this in any component which is rendered on the page
  public ngDoCheck() {
    console.log('doCheck', Zone.currentTask.source);
  }
This will output something like this:
![enter image description here]()
This is already something and you have the direction of further researching, but it's still not perfect.
To find a real place where action handler is defined we need zone's long-stack-trace spec.
// add this, for example, in your polyfills file
import 'zone.js/dist/long-stack-trace-zone';
Now additionally to the source of task we can check data prepared by long-stack-trace
  public ngDoCheck() {
    console.log('doCheck', Zone.currentTask.source, Zone.currentTask.data.__creationTrace__);
  }
This will output an array:
![enter image description here]()
We are interested in error property of each entry in the array.
Start investigating in console from 0 element, and then go further.
Inside this property will be a stack trace like this:
![enter image description here]()
Maybe this way is overcomplicated, but this is what I've found by reading source code of Zone.
Will be really glad if someone suggests an easier solution.
Update 1
I created a small snippet, which can help you to extract long stack traces
function renderLongStackTrace(): string {
  const frames = (Zone.currentTask.data as any).__creationTrace__;
  const NEWLINE = '\n';

  // edit this array if you want to ignore or unignore something
  const FILTER_REGEXP: RegExp[] = [
    /checkAndUpdateView/,
    /callViewAction/,
    /execEmbeddedViewsAction/,
    /execComponentViewsAction/,
    /callWithDebugContext/,
    /debugCheckDirectivesFn/,
    /Zone/,
    /checkAndUpdateNode/,
    /debugCheckAndUpdateNode/,
    /onScheduleTask/,
    /onInvoke/,
    /updateDirectives/,
    /@angular/,
    /Observable\._trySubscribe/,
    /Observable.subscribe/,
    /SafeSubscriber/,
    /Subscriber.js.Subscriber/,
    /checkAndUpdateDirectiveInline/,
    /drainMicroTaskQueue/,
    /getStacktraceWithUncaughtError/,
    /LongStackTrace/,
    /Observable._zoneSubscribe/,
  ];

  if (!frames) {
    return 'no frames';
  }

  const filterFrames = (stack: string) => {
    return stack
      .split(NEWLINE)
      .filter((frame) => !FILTER_REGEXP.some((reg) => reg.test(frame)))
      .join(NEWLINE);
  };

  return frames
    .filter(frame => frame.error.stack)
    .map((frame) => filterFrames(frame.error.stack))
    .join(NEWLINE);
}
Usage:
  public ngDoCheck() {
    console.log(renderLongStackTrace());
  }
Update 2
I found that for EventTask, zone's long-stack-trace create wrong stack traces, you can track this issue here https://github.com/angular/zone.js/issues/1195
Update 3
It's worth to set Error.stackTraceLimit = Infinity; before application bootstrap (not for production), because stack traces with angular + zone can be really looong.


setIntervals running that fast nor can I imagine any async activity I'm using doing that much stuff, unless some library I'm using is going haywire... either way it would be great to just find out what's causing any given round of change detection. – Sorildaargumentsfrom breakpoint insideZoneDelegate.prototype.invoke(argument names aretargetZone, callback, applyThis, applyArgs, source): pastebin.com/MhZZZZSG. No info really except that it's the Angular zone (vialong-stack-trace). – Sorilda