Forex historical data in Python
Asked Answered
A

9

15

I need solutions to get historical Forex data in Python.

For stocks it is easy:

import pandas as pd
import pandas_datareader as pdr

start = dt.date.today() - dt.timedelta(days=30)
end = dt.date.today()

df = pdr.DataReader('AAPL', 'google', start, end)
print(df.head())

I have tried Google, Yahoo, Fred and Oanda. Nothing seems to work.

Please give a code example of how to request the data. (In most cases one line should be fine).

Argentite answered 17/6, 2017 at 12:6 Comment(0)
C
10

Do you just need historical currency values?

Try using the forex_python module with the datetime class ( from the datetime module ). I'm using python 3 but I doubt that matters too much.

These exchange rates are the 3pm (CET) data from the European Central Bank, since 1999.

>>> from datetime import datetime
>>> from forex_python.converter import get_rate

>>> t = datetime(2001, 10, 18)  # the 18th of October, 2001
>>> get_rate("USD", "GBP", t)
0.69233
>>> get_rate("GBP", "USD", t)
1.4444
>>> 1 / 1.4444   # check
0.6923289947382997 

>>> t = datetime(2006, 6, 26)  # June 26th, 2006
>>> get_rate("GBP", "USD", t)
1.8202

So
on 18/10/01, 1 USD == 0.69 GBP,
on 26th June, 2006, 1 GBP == 1.82 USD.

Clovis answered 6/8, 2017 at 8:51 Comment(3)
Of course, true. I'll clarify that it's the daily (3pm) data from the European Central Bank.Clovis
Absolutely worth to note that. The downvoting hysteria downthere was a bit of surprise ...Lilililia
so how can I download a range with this? Documentation says it only supports single datesOversoul
T
5

The retail broker feed is always skewed but I don't agree that there is no good historical feed. The industry standard for FX is EBS feed. However, it is an expensive option. The FXMarketAPI offers a feed that closely matches this. It is not affiliated to any broker. The API has a pandas endpoint which helps you pull data. Though there is a limit of 1000 request for free users. you can see an example below.

URL = "https://fxmarketapi.com/apipandas"
params = {'currency' : 'EURUSD',
'start_date' : '2018-07-02',
'end_date':'2018-12-06',
'api_key':'**************'}

response = requests.get("https://fxmarketapi.com/apipandas", params=params)
df= pd.read_json(response.text)
Telescopium answered 11/12, 2018 at 16:8 Comment(1)
I'm getting an "500 Internal Server Error" with this codeOversoul
C
4

Maybe you are not looking hard enough :) A very good looking chap published this a few months ago. Admittedly this is not the best code (first open source project), however, it is currently under development and continuously improving. The next version will be much more efficient and cleaner.

fx_collect

Designed to store all of FXCM's historical data locally in Mariadb like so.

    +---------------------+-----------+-----------+-----------+-----------+-----------+-----------+-----------+-----------+--------+
    | date                | bidopen   | bidhigh   | bidlow    | bidclose  | askopen   | askhigh   | asklow    | askclose  | volume |
    +---------------------+-----------+-----------+-----------+-----------+-----------+-----------+-----------+-----------+--------+
    | 2017-04-27 10:01:00 | 17.294000 | 17.296000 | 17.289000 | 17.290000 | 17.340000 | 17.340000 | 17.334000 | 17.335000 |    113 |
    | 2017-04-27 10:02:00 | 17.290000 | 17.298000 | 17.285000 | 17.295000 | 17.335000 | 17.342000 | 17.330000 | 17.340000 |    114 |
    | 2017-04-27 10:03:00 | 17.295000 | 17.301000 | 17.289000 | 17.299000 | 17.340000 | 17.347000 | 17.340000 | 17.344000 |     98 |
    | 2017-04-27 10:04:00 | 17.299000 | 17.300000 | 17.286000 | 17.295000 | 17.344000 | 17.345000 | 17.330000 | 17.340000 |    124 |
    | 2017-04-27 10:05:00 | 17.295000 | 17.295000 | 17.285000 | 17.292000 | 17.340000 | 17.340000 | 17.330000 | 17.336000 |    130 |
    | 2017-04-27 10:06:00 | 17.292000 | 17.292000 | 17.279000 | 17.292000 | 17.336000 | 17.336000 | 17.328000 | 17.332000 |     65 |
    | 2017-04-27 10:07:00 | 17.292000 | 17.304000 | 17.287000 | 17.298000 | 17.332000 | 17.348000 | 17.332000 | 17.345000 |    144 |
    | 2017-04-27 10:08:00 | 17.298000 | 17.306000 | 17.297000 | 17.302000 | 17.345000 | 17.350000 | 17.343000 | 17.346000 |     96 |
    | 2017-04-27 10:09:00 | 17.302000 | 17.303000 | 17.294000 | 17.294000 | 17.346000 | 17.346000 | 17.338000 | 17.338000 |     50 |
    | 2017-04-27 10:10:00 | 17.294000 | 17.296000 | 17.281000 | 17.291000 | 17.338000 | 17.338000 | 17.328000 | 17.333000 |     50 |

or if you just want the basic tools to get you started and build your own.

python-forexconnect

A Demo or Live FXCM account is required to obtain the data. They provide free 10-year historical data, in different timeframes (fxcm).

Clemenceau answered 10/9, 2017 at 17:29 Comment(1)
fx_collect does not support csv?Oversoul
M
3

FXCM recently released an official python wrapper for forexconnect.

There is a support forum: http://www.fxcodebase.com/code/viewforum.php?f=51&sid=e2b414c06f9714c605f117f74d689a9b

There is a code snippet from an article about getting history:

from forexconnect import fxcorepy, ForexConnect
    with ForexConnect() as fx:
        try:
            fx.login("user_id", "password", "fxcorporate.com/Hosts.jsp",
                     "Demo", session_status_callback=session_status_changed)

            history = fx.get_history("EUR/USD", "H1",
                                    datetime.datetime.strptime("MM.DD.YYYY HH:MM:SS", '%m.%d.%Y %H:%M:%S').replace(tzinfo=datetime.timezone.utc),
                                    datetime.datetime.strptime("MM.DD.YYYY HH:MM:SS", '%m.%d.%Y %H:%M:%S').replace(tzinfo=datetime.timezone.utc))
Microdont answered 22/10, 2018 at 15:38 Comment(0)
B
3

There is free tick based historical data from pepperstone in monthly csv format starting from 2009 (visit: https://www.truefx.com/?page=downloads) for most popular pairs, i have wrote python code using selenium to download all csv files(the script will download all csv files into folder name forex):

import datetime, time, os
from dateutil.relativedelta import relativedelta

from selenium import webdriver

tmp_dir = os.path.join(os.getcwd(), 'forex')
if not os.path.isdir(tmp_dir): os.makedirs(tmp_dir)
options = webdriver.ChromeOptions();
options.add_argument("--window-size=1300,900")
options.add_experimental_option("prefs", {
    "download.default_directory": tmp_dir,
    "download.prompt_for_download": False,
    "download.directory_upgrade": True,
    "safebrowsing.enabled": False,
    "safebrowsing.disable_download_protection": True
})
options.add_argument("--disable-gpu")
options.add_argument("--disable-extensions")
options.add_argument('--disable-logging')
options.add_argument('--ignore-certificate-errors')
options.add_argument('--ignore-certificate-errors-spki-list')
options.add_argument('--no-sandbox')
browser = webdriver.Chrome(options=options)

pairs = ['AUDJPY', 'AUDNZD', 'AUDUSD', 'CADJPY', 'CHFJPY', 'EURCHF', 'EURGBP', 'EURJPY', 'EURUSD', 'GBPJPY', 'GBPUSD', 'NZDUSD', 'USDCAD', 'USDCHF', 'USDJPY']
for pair in pairs:
    curr_date = datetime.datetime(2015, 1, 1)
    while curr_date + relativedelta(months=1) < datetime.datetime.now():
        file_name = '{p}-{ym2}.zip'.format(p=pair, ym2=curr_date.strftime('%Y-%m'))
        url = 'http://www.truefx.com/dev/data/{y}/{ym1}/{p}-{ym2}.zip'.format(
            y=curr_date.strftime('%Y'),
            ym1=curr_date.strftime('%B').upper()+'-'+curr_date.strftime('%Y') if curr_date <= datetime.datetime(2017, 3, 1) else curr_date.strftime('%Y-%m'),
            p=pair,
            ym2=curr_date.strftime('%Y-%m')
        )
        file_found = False
        for root, dirs, files in os.walk(tmp_dir):
            for file in files:
                if file_name in file: file_found = True 
        if not file_found:
            time.sleep(5)
            browser.get (url)
            file_downloaded = False
            while not file_downloaded:
                time.sleep(1)
                for root, dirs, files in os.walk(tmp_dir):
                    for file in files:
                        if file_name in file and not '.crdownload' in file: file_downloaded = True
            print(file_name, 'downloaded from', url)
        curr_date = curr_date + relativedelta(months=1)
print('completed')

gist source: https://gist.github.com/mamedshahmaliyev/bca9242b7ea6a13b3f76dee7a5aa111a

Blackthorn answered 6/8, 2019 at 19:47 Comment(1)
Great work but it seems it requires a login nowOversoul
I
1

you could use fxcmpy. http://fxcmpy.tpq.io/

here's a quick example :

import matplotlib.pyplot as plt
import datetime as dt
import fxcmpy

con = fxcmpy.fxcmpy(config_file='fxcm.cfg') 
# must optain API Token, see link for details.

start = dt.datetime(2018, 7, 6,8,0,0)
end = dt.datetime(2018, 7, 7,18,0,0)

c = con.get_candles('XAU/USD', period='m1', columns=['bidclose','tickqty'], start=start, end=end )

# Basic plotting of close and volumne data

fig, ax = plt.subplots(figsize=(11,8))
ax.plot(c.index,c['bidclose'], lw=1, color='B',label="Close")
ax2= ax.twinx()
ax2.plot(c.index,c['tickqty'], lw=1, color='G',label="Volume")
plot.show()
Irrespirable answered 10/7, 2018 at 16:0 Comment(0)
D
1
from datetime import datetime
import MetaTrader5 as mt5
# display data on the MetaTrader 5 package
print("MetaTrader5 package author: ",mt5.__author__)
print("MetaTrader5 package version: ",mt5.__version__)
 
# import the 'pandas' module for displaying data obtained in the tabular form
import pandas as pd
pd.set_option('display.max_columns', 500) # number of columns to be displayed
pd.set_option('display.width', 1500)      # max table width to display
# import pytz module for working with time zone
import pytz
 
# establish connection to MetaTrader 5 terminal
if not mt5.initialize():
    print("initialize() failed, error code =",mt5.last_error())
    quit()
 
# set time zone to UTC
timezone = pytz.timezone("Etc/UTC")
# create 'datetime' objects in UTC time zone to avoid the implementation of a local time zone offset
utc_from = datetime(2020, 1, 10, tzinfo=timezone)
utc_to = datetime(2020, 1, 11, hour = 13, tzinfo=timezone)
# get bars from USDJPY M5 within the interval of 2020.01.10 00:00 - 2020.01.11 13:00 in UTC time zone
rates = mt5.copy_rates_range("USDJPY", mt5.TIMEFRAME_M5, utc_from, utc_to)
 
# shut down connection to the MetaTrader 5 terminal
mt5.shutdown()
 
# display each element of obtained data in a new line
print("Display obtained data 'as is'")
counter=0
for rate in rates:
    counter+=1
    if counter<=10:
        print(rate)
 
# create DataFrame out of the obtained data
rates_frame = pd.DataFrame(rates)
# convert time in seconds into the 'datetime' format
rates_frame['time']=pd.to_datetime(rates_frame['time'], unit='s')
 
# display data
print("\nDisplay dataframe with data")
print(rates_frame.head(10))
Doubleripper answered 18/12, 2021 at 0:33 Comment(1)
Thanks! I tried all answers in this thread and this was the only straight forward one that worked and I didn't have to sign up to anything. No paywallOversoul
L
-1

(cit.: ) In most cases one line should be fine ?

One cannot be more wrong in this.

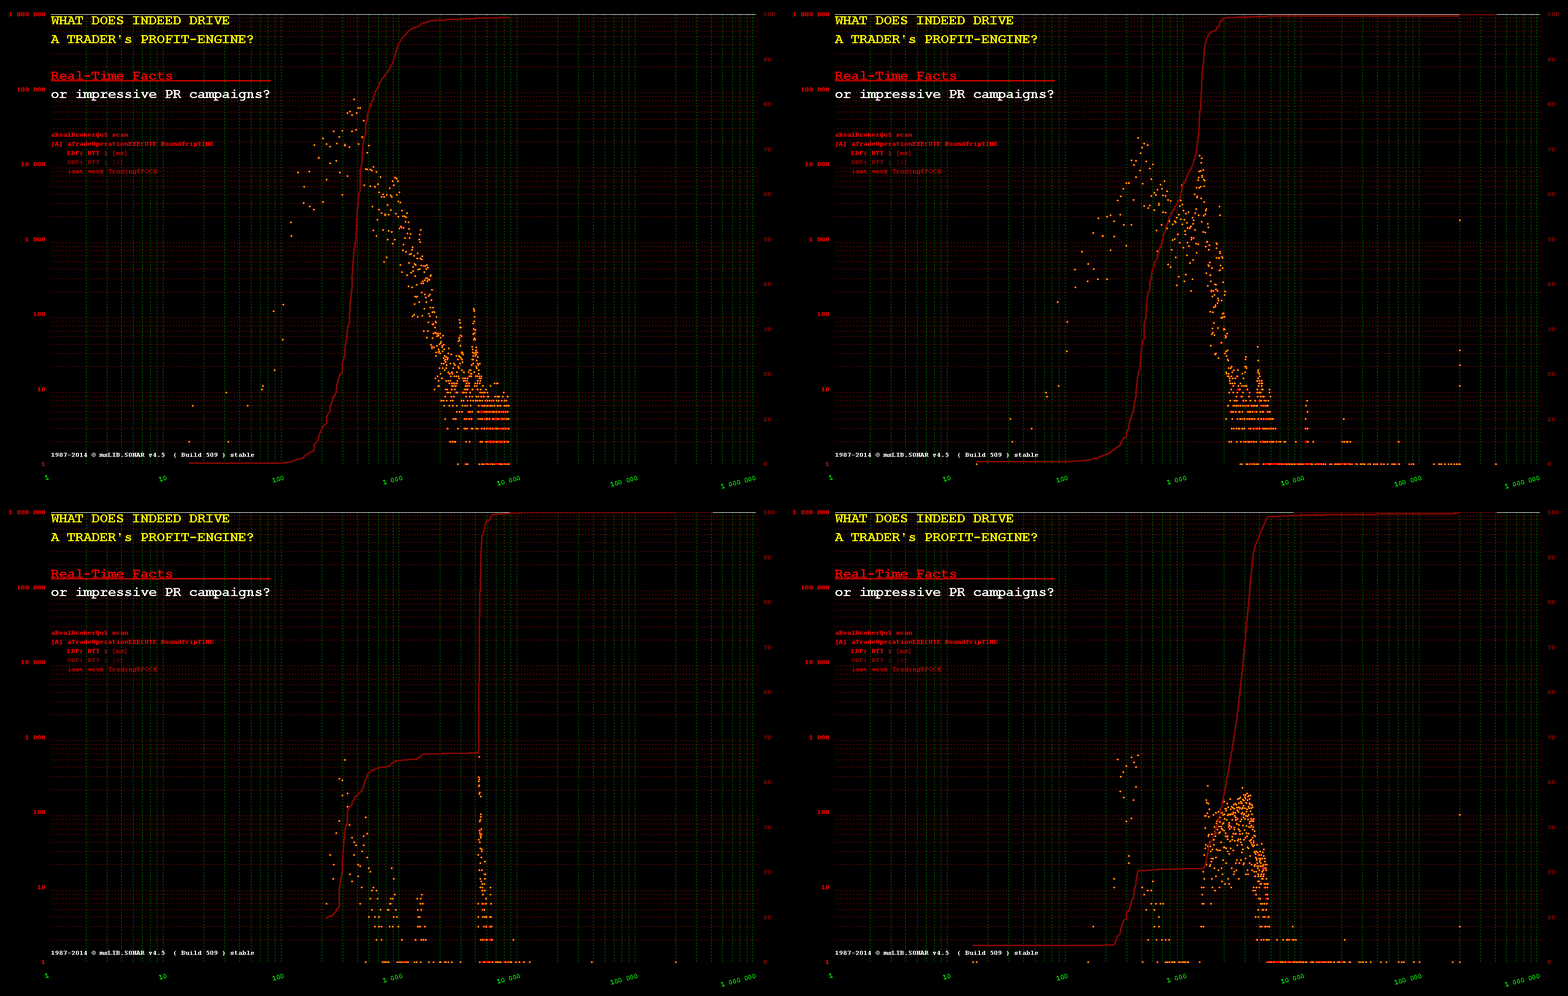
There is nothing as FOREX historical data. Each FX trading mediator ( Broker ) creates their own trading Terms & Conditions. Even the same Broker may provide several different ( or inconsistent if one wishes ) price-feeds for the same currency-pair trading, so that each "product's" T&C could be met.

FOREX eco-system is a decentralised, multi-agent / multi-role, principally distributed, global market.

So rather forget to have a SLOC, a magic one-liner to get a universally valid response from some nonexistent divine API. There is none such.


Yes, can receive FX data - but each Broker provides a different picture:

enter image description here Yes, one may integrate localhost process against a distinct API service from one particular Broker, for one particular type of trading account ( ref. the respective T&C for detailed context of such a data-feed ).

Some Brokers publish their local tick-data, some do not. Some research agencies may help you in some research-motivated efforts and share selected segments of the tick-data for a particular CCY pair. But there is zero global consolidation. It simply has no reason to aggregate such service, that has zero value added.

If one's quantitative modelling in-vitro ought make any sense, that model ought be validated with respect to the very same marketplace, where the trading is expected to take place in-vivo.

So you need that one particular Market access Mediator's data ( the Broker to ask for this ), where your service is heading to operate in-vivo.

Lilililia answered 17/6, 2017 at 14:7 Comment(4)
Thanks for the info. (1) So, what you are saying is that there is no daily historical data available for say EUR/USD from Google, Yahoo or Fred, right? This would have been my preference and it is a bit strange, because one can get quotes from them and historical data graphs: google.com/finance?q=EURUSD (2) How about from a broker like Oanda? I tried using the following function without success: get_oanda_currency_historical_rates() .Argentite
Ad-(1) No, what I say is, that if one takes any kind of data from a Venue [A], it has no value for a trading model simulations and execution on a Venue [B] as each Venue has different conditions and thus also the quote-streams for the same currency pair, their respective elasticity & hysteresis to dynamic events, as the animation for each different Broker depicts above. There are no two Brokers having the same identical response to a flow of market events. Ad-(2) What was the Oanda official Technical Support's response to your non-functional API-claims so far?Lilililia
For Oanda, it seems one have to be a premium member: github.com/pydata/pandas-datareader/issues/296 And it seems to be expensive: oanda.com/fx-for-business/exchange-rates-apiArgentite
Those are some interesting points you bring up. However can you demonstrate that different brokers really give out different data? The GIF you linked is a table of RTT (round trip times?) it's a table of how quick brokers respond? Or what is it?Nilla
C
-1

You can use Tradermade Python SDK which provides daily historical data and represents an aggregated feed from banks and brokers. As its independent data provider, you are unlikely to see skewed rates. You can compare this to your broker feed to check the skew.

pip install tradermade

import tradermade as tm

# set api key
tm.set_rest_api_key("api_key")

# get timeseries data

tm.timeseries(currency='EURUSD', start="2022-04-20",end="2022-04-22",interval="daily",fields=["open", "high", "low","close"])  
Coverlet answered 1/7, 2022 at 10:46 Comment(1)
Before you try, be aware that there is a paywall for periods bigger than 1 yearOversoul

© 2022 - 2024 — McMap. All rights reserved.