How can I see request count (not rate) for a Google Cloud Run application?
Asked Answered
M

4

15

I deployed a Google Cloud Run service running in a docker container. Out of the box, it looks like I get insight into some metrics on the Metrics tab of the service page such as Request count, Request latencies and more. Although it sounds like request count would answer my question, what I am really looking for is insight into adoption so that I can answer "How many visits to my application were there in the past week" or something like that. Is there a way to get insight like that out of the box?

Currently, the Request count metric reports responses/second, so I can see blips that look like "0.05/s", which can give me some insight but it's hard to aggregate.

I've tried using the Monitoring > Metrics explorer as well, but I'm not seeing any data for the metrics I select. I'm considering hooking into Google Analytics from within my application if that seems like the suggested solution. Thank you!

Monoplegia answered 12/5, 2020 at 15:50 Comment(0)
S
25

I've realized it's quite difficult to have Metrics Explorer give you a straight answer on "how many requests I received this month". However, it's possible:

Go to Metrics Explorer as you said, choose resource type "Cloud Run Revision" (cloud_run_revision) and you'll see "Request Count" (run.googleapis.com/request_count) metric:

Description: Number of requests reaching the revision. Excludes requests that are not reaching your container instances (e.g. unauthorized requests or when maximum number of instances is reached).

Resource type: cloud_run_revision

Unit: number Kind: Delta Value type: Int64

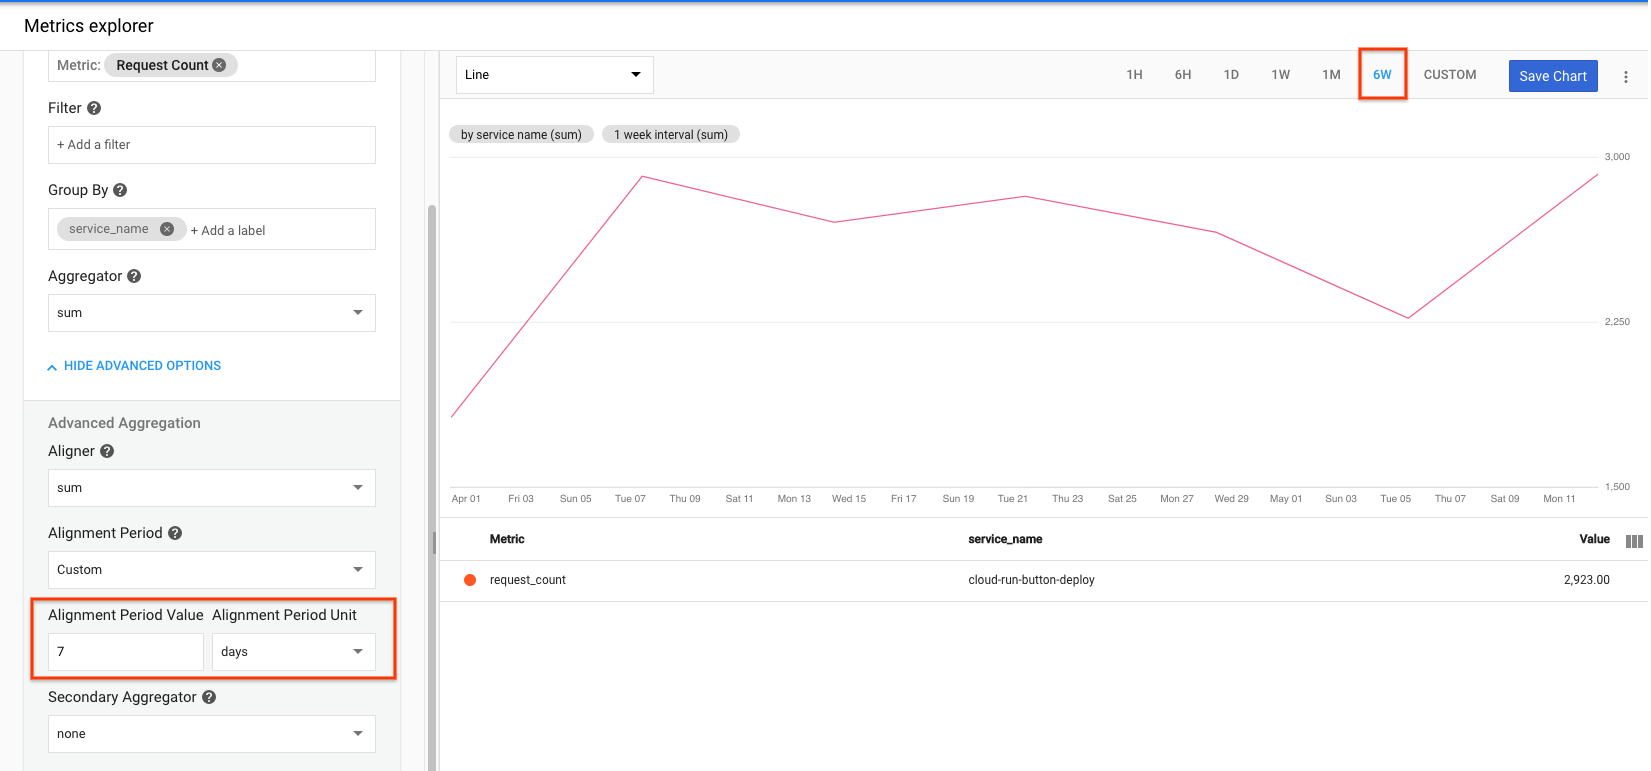
Then, choose Aggregator: None, and click Show Advanced Options. In the form, choose Aligner: sum (instead of default "Rate" default). You now should be able to see total request count per minute:

enter image description here

Now if you change "Alignment Period" to "10 minutes", you'll see one data point for every 10m (sadly, there seems to be a bug that says X req/s, but that's more like X reqs/10m in this case):

If you collect enough data, you can change "Alignment Period" to "Custom" and set 30 days, then update your timeframe on the top to 1 year and see monthly request count.

This does not show sums of all Alignment Periods (I think that part is up to you to do manually, maybe possible via the API), but it lets you see requests per month. For example, here's a service I've been running for some months and I set alignment period to 7 days, viewing past 6 weeks, so I get 6 data points on weekly request count. Hope this helps.

Sonnier answered 12/5, 2020 at 16:36 Comment(3)
An alternative, for the next month, is to sink the Cloud Run logs (all or only the line that you want) into BigQuery and then to perform the request that you want on them.Olympium
I agree with Guillaume's suggestion. An export to BigQuery will allow to COUNT(*) all requests in a monthSampler
Can the BQ query be turned into a metric then? Ultimately I'd like to have a cumulative metric that counts the total number of requests for the past X days.Regress
I
3

In 2024 with the updated Google Cloud Platform UI, here is how to do something similar to ahmet's answer albeit without the alignment period:

  1. Select the metric, in this case Cloud Run Revision - Request Count
  2. Change to PromQL. Use the increase function along with a time duration over how long you want to measure changes. E.g. the following function will give the change over the last month:
increase(run_googleapis_com:request_count{monitored_resource="cloud_run_revision"}[4w])
  1. I couldn't figure out how to do the old Alignment Period in PromQL but you can group everything together by switching the widget to "Stacked Bar Chart" and picking out a zoomed out time range in the top right. For me, "12mo" was far enough out to group everything by month.
Interlinear answered 29/2, 2024 at 23:19 Comment(0)
M
1

If you manipulate the promql code in the request count chart as follows, it will give you the daily request count as a table.

sum(rate(loadbalancing_googleapis_com:https_request_count{monitored_resource="https_lb_rule"}[${__interval}]) * 1440)
Mosby answered 6/5, 2024 at 13:48 Comment(0)
M
1

It seems that the aligner is chosen based on the metric type - and it likes to default to Rate. It is possible to override this though and rather get a bucketed count.

In the GCP Console, under APIs and Services, click the link for the API you're interested in, e.g. Vertex AI API. In the resulting Metrics overview page, click the Explore data icon above the chart you're interested in, e.g. Traffic by response code. This takes you to Metrics Explorer where you'll be shown a line chart with rate values, by default.

This is where it gets good. In the Aggregation dropdown, select Configure aligner. You should now be able to change the default Alignment function from Rate to Count. You can click the Plus button to the right of Alignment function and select Min. interval to be able to have some control over the (minimum) bucket size.

Alternatively, you could just use this MQL directly in Metrics Explorer to get you most of the way there.

fetch consumed_api
| metric 'serviceruntime.googleapis.com/api/request_count'
| filter (resource.service == 'aiplatform.googleapis.com')
| group_by 1h, [row_count: row_count()]
| every 1h
| group_by [resource.credential_id], [row_count_aggregate: aggregate(row_count)]
Milissamilissent answered 13/6, 2024 at 6:53 Comment(0)

© 2022 - 2025 — McMap. All rights reserved.