Facetgrid change xlabels
Asked Answered
P

2

15

I just can't figure out how to change the xlabels in a Seaborn FacetGrid. It offers a method for changing the x labels with set_xlabels() but unfortunately not individually for each subplot.

I have two subplots which share the y-axis but have a different x-axes and I want to label them with different texts.

Pasley answered 12/4, 2016 at 12:48 Comment(1)
As per seaborn.FacetGrid, it's better to directly use figure-level functions like g = sns.relplot(data=tips, kind='scatter', ...) instead of sns.FacetGrid. The answers still work for this.Lewis
C
39

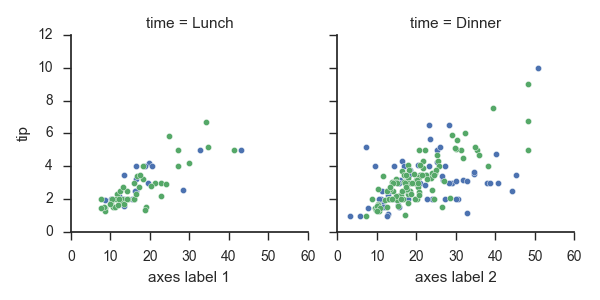
You can access the individual axes of the FacetGrid using the axes property, and then use set_xlabel() on each of them. For example:

import seaborn as sns
import matplotlib.pyplot as plt

sns.set(style="ticks", color_codes=True)

tips = sns.load_dataset("tips")

g = sns.FacetGrid(tips, col="time",  hue="smoker")
g = g.map(plt.scatter, "total_bill", "tip", edgecolor="w")

g.axes[0,0].set_xlabel('axes label 1')
g.axes[0,1].set_xlabel('axes label 2')

plt.show()

enter image description here

Note in this example, g.axes has a shape of (1,2) (one row, two columns).

Charmine answered 12/4, 2016 at 12:55 Comment(0)
M
0

for all axis to set them once use this

g.set_axis_labels("Total bill ($)")
Multiplex answered 1/12, 2021 at 11:3 Comment(1)
The question is about individual axes labels for each subplot, therefore, your answer is not working (I made the same mistake when I read the question),Puzzlement

© 2022 - 2025 — McMap. All rights reserved.