Firebase trace showing wrong median time latency?
Asked Answered
A

2

2

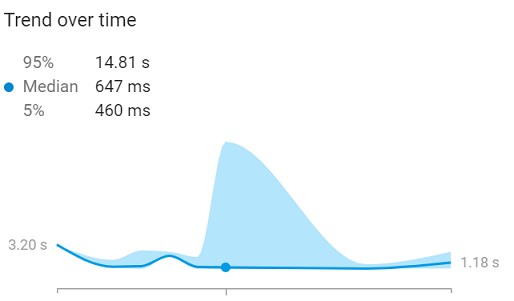
I am adding Firebase performance trace in my app and below image is data for last 24 Hrs

enter image description here

As you can see the Median is 647ms, where as 95% time latency is 14.81s and for 5% it is 460ms.

How can the median be 647ms, it should be near around 14 sec? Am I missing something here?

Edit -

In below image data is for last 7 days

enter image description here

As you can see in last 24 Hrs I had data where 95th percentile was 14.81s, but how can in last 7 days graph there is no mention of the 14 secs trace? all traces are below 5.95s?

Also in the distribution image latency is between 460 ms to 2.94s but as 95th percentile in first image is 14.81s and in second image it is 5.95s but distribution is only showing data between 460ms-2.94s? Then what is this distribution data showing? Shouldn't they show here all requests time delay in the last 7 days?

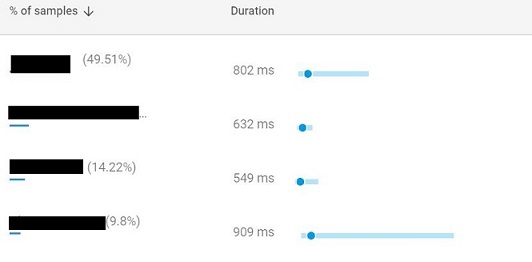
Also when I am checking in devices samples

enter image description here

the time delay maximum in all cases is 5.60s not 14.81s?

Ashleighashlen answered 26/9, 2018 at 17:57 Comment(1)
Facing the same issue. Very weird the median and 95% differ just too much. Any new update @Sudhanshu?Snider
A
2

95% does not mean 95% of the time, it is the 95th percentile in the value range, not to be confused with frequency.

Most (90%) of your "executions" will be between 5-95% so it makes sense that the median is 647 ms.

I don't know exactly what the 95% value represents, it could be an average of the top 5% execution times or it could be the first value in the range.

Azzieb answered 27/9, 2018 at 7:30 Comment(7)
Thanks for helping, Can you please check my edited post?Ashleighashlen
Your last device looks like it could have 14.81s if I read the graph correctly. I don't have any experience with Firebase traces specifically.Azzieb
It's not about traces, I want to know in last 24 hrs when I got 14.81s time, then why in last 7 days graph 14.81s is not there, also for sample devices maximum time for any device is 5.60s not 14.81s?Ashleighashlen
Well, you have more data in 7 days than in 24 hours so the 95th percentile could very well be 5.60s. It does not mean that the 14.81s execution time is not there, it is simply closer to the max value in the range.Azzieb
In devices data also no mentioning of 14.81s, just tell me one thing suppose I need to look for delays like these, now first I need to see (0-100%) of time delay then only I can take the action, but as if it will only show 95th percentile, then how can I know by clicking on last 7 days tab that maximum time delay is 14.81s because it shows it is only greater than 5.60s but how much ? may be for some cases it can be like 50s where it needs immediate attention, Or in some case sit can be like 6s which does not need immediate attention?Ashleighashlen
Like I said, I don't have any experience with Firebase performance monitoring so I cannot tell you where to look. But the last device sample in your screenshot (median 909 ms) looks like it has very high values.Azzieb
Yeah but in last image last record 95th percentile was 5.80s, there they should show 100th percentile? because I think it must have 14.81s.Ashleighashlen
H
1

I think the behavior that you are facing is this:

You are sending this metrics (sorted):

Day 1: ..., 460ms, ..., ..., 647ms, ..., ..., 14.81s, ... 5th 50th 95th

That explains the first graph, in the next days you are sending different total number of metrics. (I set some random numbers):

Day 2: ..., 460ms, ..., ..., 647ms, ..., ..., 2.95s, ... 5th 50th 95th

Day 3: ..., 460ms, ..., ..., 647ms, ..., ..., 2.95s, ... 5th 50th 95th

Day 4: ..., 619ms, ..., ..., 971ms, ..., ..., 5.95s, ... 5th 50th 95th

Day 5: ..., 460ms, ..., ..., 647ms, ..., ..., 2.94s, ... 5th 50th 95th

Day 6: ..., 460ms, ..., ..., 647ms, ..., ..., 2.01s, ... 5th 50th 95th

That could explain second graph, and since the third graph shows a distribution across 7 days (merge all your metrics into a single array and computes the percentiles), that explains how the 95th which it should be different than most of your every day 95th (unless the metrics that you send are the same every day).

In addition I noticed that you in fact can check the 100th in the response of the network request made by the Firebase Console from your browser, (I think UI decided to don't render this value).

Helgahelge answered 5/10, 2018 at 18:2 Comment(0)

© 2022 - 2024 — McMap. All rights reserved.