Profiling inlined C++ functions with Visual Studio Compiler
Asked Answered
A

2

16

How can I make sense of C++ profiling data on Windows, when a lot of code gets inlined by the compiler? I.e. I of course want to measure the code that actually gets run, so by definition I'm going to measure an optimized build of the code. But it seems like none of the tools I try actually manage to resolve inline functions.

I have tried both the sampling profiler in Visual Studio 2017 Professional as well as VTune 2018. I have tried to enable /Zo, but it does not seem to have any affect.

I have found the following resource which seems to indicate that only Visual Studio Ultimate or Premium support inline frame information - is this still true for Visual Studio 2017? https://social.msdn.microsoft.com/Forums/en-US/9df15363-5aae-4f0b-a5ad-dd9939917d4c/which-functions-arent-pgo-optimized-using-profile-data?forum=vsdebug

Here is an example code:

#include <cmath>
#include <random>
#include <iostream>

inline double burn()
{
    std::uniform_real_distribution<double> uniform(-1E5, 1E5);
    std::default_random_engine engine;
    double s = 0;
    for (int i = 0; i < 100000000; ++i) {
        s += uniform(engine);
    }
    return s;
}

int main()
{
    std::cout << "random sum: " << burn() << '\n';
    return 0;
}

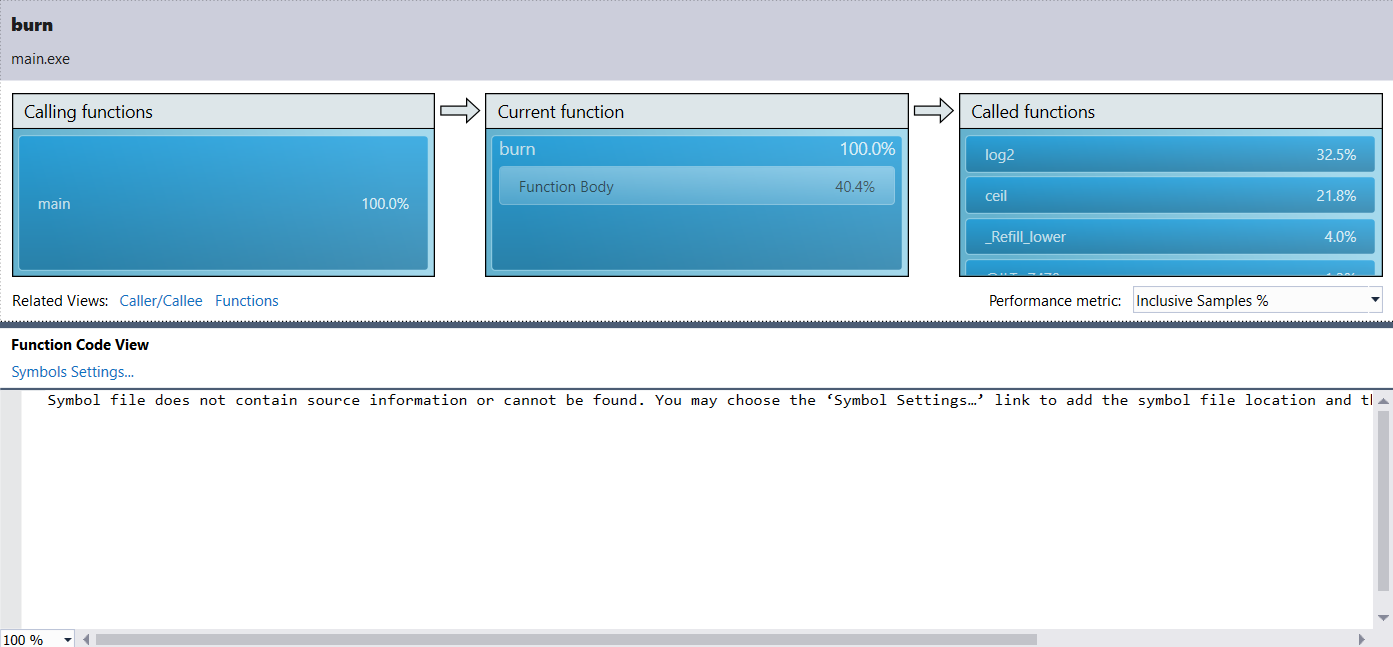
Compile it with Visual Studio in Release mode. Or on the command line, try cl /O2 /Zi /Zo /EHsc main.cpp. Then try to profile it with the CPU Sampling Profiler in Visual Studio. You will at most see something like this:

confusing profile since inline frames are missing

VTune 2018 looks similar on Windows. On Linux, perf and VTune have no problem showing frames from inlined functions... Is this feature, which is in my opinion crucial for C++ tooling, really not part of the non-Premium/Ultimate Visual Studio toolchains? How do people on Windows deal with that? What is the point of /Zo then?

EDIT: I just tried to compile the minimal example above with clang and it produces different, but still unsatisfying results? I compiled clang 6.0.0 (trunk), build from LLVM rev 318844 and clang rev 318874. Then I compile my code with clang++ -std=c++17 -O2 -g main.cpp -o main.exe and run the resulting executable with the Sampling Profiler in Visual Studio again, the result is:

inline frames are shown in profile after compiling with clang

So now I see the burn function, but lost the source file information. Also, the uniform_real_distribution is still not being shown anywhere.

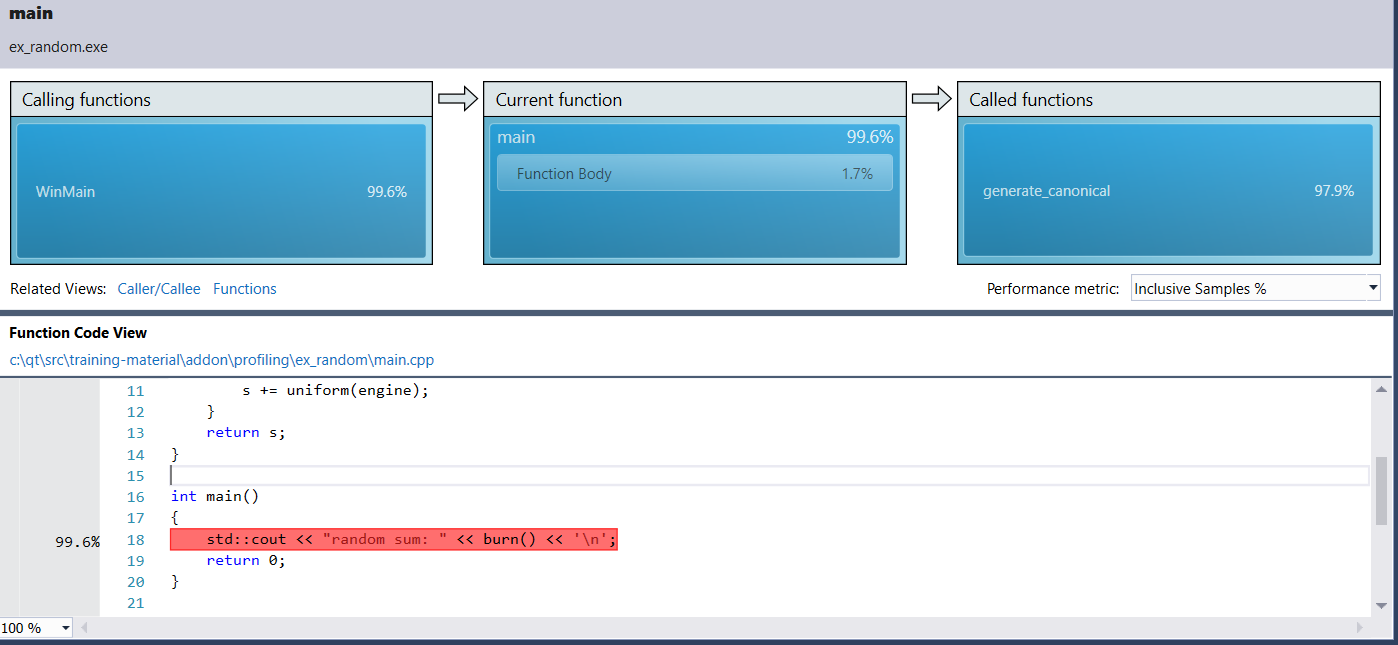
EDIT 2: As suggested in the comments, I now also tried out clang-cl with the same arguments as cl above, i.e.: clang-cl.exe /O2 /Zi /Zo /EHsc main.cpp. This produces the same results as clang.exe, but we also get somewhat working source mappings:

clang-cl shows inliners and somewhat functional source mapping

EDIT 3: I originally thought clang would magically solve this issue. It doesn't, sadly. Most inlined frames are still missing :(

EDIT 4: Inline frames are not supported in VTune for applicatoins build with MSVC/PDB builds: https://software.intel.com/en-us/forums/intel-vtune-amplifier-xe/topic/749363

Argol answered 28/11, 2017 at 21:57 Comment(3)
Based on this document: visualstudio.com/vs/compare, current VS2017 versions support the Performance and Diagnostics Hub feature, no VS2017 Premium/Ultimate now. If you really want to know the result, I can setup different VS Environment and test it later, but sorry for that I'm not very sure that how you profile your app and get this issue like the second screen shot in your side. If we want to profile your app, as far as I know, two ways, using the VS IDE or the profiling command line. Do you mean that you use other tools or command line?Fieldwork
@JackZhai-MSFT Yes, the CPU profiler is available in VS 2017. What doesn't seem to be available is the feature to show inline frames. See also: blogs.msdn.microsoft.com/vcblog/2013/06/27/… This simply does not work at all in Visual Studio 2017Argol
Can you try with clang-cl instead (or clang.exe --driver-mode=cl) and pass the same arguments you passed to cl, and see what happens ? If it still works then we'll know we're not missing some magical cl option that would fix thisLanellelanette
N
3

I have tried both the sampling profiler in Visual Studio 2017 Professional as well as VTune 2018. I have tried to enable /Zo, but it does not seem to have any affect.

I have found the following resource which seems to indicate that only Visual Studio Ultimate or Premium support inline frame information - is this still true for Visual Studio 2017?

Fortunately, I already have three different versions of VS installed. I can tell you more information on the support for the inlined functions information feature as discussed in the article you referenced:

  • VS Community 2013 Update 5 does not support showing inlined functions even when I specify /d2Zi+. It seems that it is only supported in VS 2013 Premium or Ultimate.
  • VS Community 2015 Update 3 does support showing inlined functions (the feature discussed in the article). By default, /Zi is specified. /Zo is enabled implicitly with /Zi, so you don't have to specify it explicitly. Therefore, you don't need VS 2015 Premium or Ultimate.
  • VS Community 2017 with the latest update does not support showing inlined functions irrespective of /Zi and /Zo. It seems that it is only supported in VS 2017 Professional and/or Enterprise.

There is no announcement on the VC++ blog regarding any improvements to the VS 2017 sampling profiler, so I don't think it is any better compared to the profiler of VS Community 2015.

Note that different versions of the compiler may make different optimization decisions. For example, I've observed that VS 2013 and 2015 don't inline the burn function.

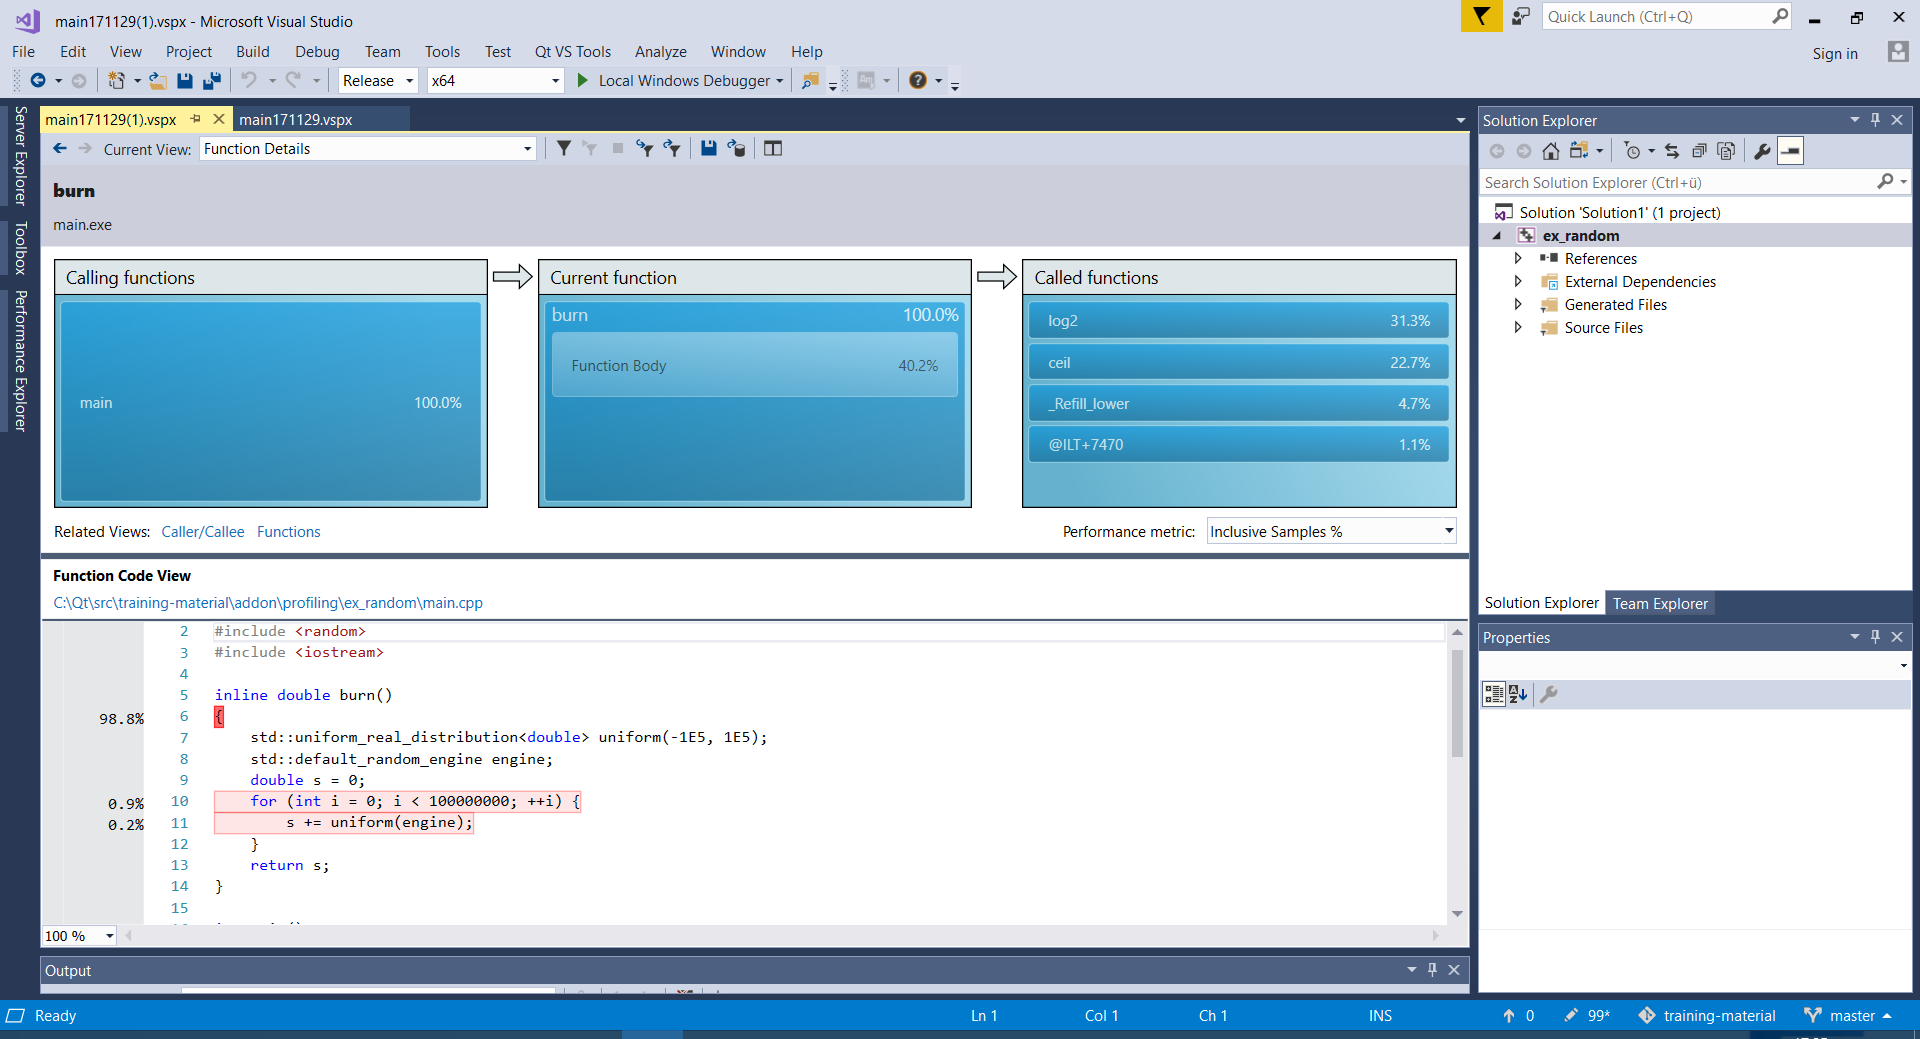
By using VS Community 2015 Update 3, I get profiling results very similar to what is shown in the third picture and the same code is highlighted.

Now I will discuss how this additional information can be useful when interpreting the profiling results, how can you get that manually with some more effort, and how to interpret the results despite of inlined functions.

How can I make sense of C++ profiling data on Windows, when a lot of code gets inlined by the compiler?

The VS profiler will only attribute costs to functions that were not inlined. For functions that were inlined, the costs will be added up and included in some caller function that was not inlined (in this case, the burn function).

By adding up the estimated execution time of the non-inlined called functions from burn (as shown in the picture), we get 31.3 + 22.7 + 4.7 + 1.1 = 59.8%. In addition, the estimated execution time of the Function Body as shown in the picture is 40.2%. Note that 59.8% + 40.2% = 100% of the time spent in burn, as it should be. In other words, 40.2% of the time spent in burn was spent in the body of the function and any functions that were inlined in it.

40.2% is a lot. The next logical question is, which functions get inlined in burn? By using that feature I discussed earlier (which is available in VS Community 2015), I can determine that the following functions were inlined in burn:

std::mersenne_twister_engine<unsigned int,32,624,397,31,2567483615,11,4294967295,7,2636928640,15,4022730752,18,1812433253>::{ctor};
std::mersenne_twister<unsigned int,32,624,397,31,2567483615,11,7,2636928640,15,4022730752,18>::{ctor};
std::mersenne_twister<unsigned int,32,624,397,31,2567483615,11,7,2636928640,15,4022730752,18>::seed;
std::uniform_real<double>::operator();
std::uniform_real<double>::_Eval;
std::generate_canonical;

Without that feature, you'll have to manually disassemble the emitted executable binary (either using the VS debugger or using dumpbin) and locate all the x86 call instructions. By comparing that with the functions called in the source code, you can determine which functions got inlined.

The capabilities of the VS sampling profiler up to and including VS 2017 end at this point. But it's really not a significant restriction. Typically, not many functions get inlined in the same function due to a hard upper limit imposed by the compiler on the size of each function. So it's generally possible to manually check the source code and/or the assembly code of each inlined function and see if that code would contribute significantly to the execution time. I did that and it's likely the case that the body of burn (excluding inlined functions) and these two inlined functions are mostly responsible for that 40.2%.

std::mersenne_twister<unsigned int,32,624,397,31,2567483615,11,7,2636928640,15,4022730752,18>::seed;
std::uniform_real<double>::_Eval;

Putting all of that into consideration, the only potential optimization opportunity I see here is to memoize the results of log2.

The VTune sampling profiler is certainly more powerful than the VS sampling profiler. In particular, VTune attributes costs to individual source code lines or assembly instructions. However, this attribution is highly approximated and often nonsensical. So I would be very careful when interpreting the results visualized in that way. I'm not sure whether VTune supports the Enhance Optimized Debugging information or to what degree it supports attributing costs to inlined functions. The best place to ask these questions is the Intel VTune Amplifier community forum.

Noggin answered 4/12, 2017 at 0:45 Comment(8)
Thanks a lot for this response. I'll leave this question open for a while and will then accept your answer. Some other comments: When the inline information actually exists, then I can report a feature request for VTune, asking them to show inline frames there too. Good. But could it be that you referenced the wrong link for "that feature"? You linked to the blog post I also found earlier, twice, which does not tell me how you actually found the inlined functions. Or do you actually hae Ultimate/Premium VS? Note that I have VS 2017 Professional, and I cannot see inline frames!Argol
@Argol The blog post shows how to add the "Inlined Functions" column, which contains the list of inlined functions. I used VS Community 2015 Update 3. If it is not there in VS 2017 Professional, then I guess it is only in VS 2017 Enterprise, which I don't have. By the way, you can still download VS Community 2015 Update 3 for free from Microsoft.Noggin
So you are saying that your VS Community 2015 actually shows the inline frames in the profiler, following the blog post? How can it be that a free version of 2015 has more features than a commercial version of 2017?Argol
@Argol Yes, that is the case. I'm surprised too.Noggin
Just checked with VS Community 2017, and I also see the feature available there. I'll have to recheck on my other machine with the Enterprise VS version and see if the feature is really disabled there (it would be very surprising - hopefully I just overlooked it multiple times...). After having played with the feature in Visual Studio, I have to say that it's really a long way off to the tooling available on Linux... Perf/Hotspot/VTune actually can do proper cost attribution to inline frames, doing your manual analysis automatically for you. Sad. I'll accept your answer now.Argol
@Argol The "Inlined Functions" column is there in Community 2017? I don't see it. The version I'm using is 15.4.5. Which version are you using?Noggin
Haha this is such a mess! I'm using version 15.5.0 but visualstudio.com/en-us/news/releasenotes/vs2017-relnotes does not mention anything in that regard... I think there is a bug here somewhere - why do you see it in one version and not the other? Why do I not see it on Enterprise 2017? Clearly something is broken here...Argol
@Argol Agreed.Noggin
C
0

I am not sure if I understood the problem described in your question properly. On your site I would try the /Ob0 Visual C++ compiler option. It must disable inline expansion.

The /Ob compiler option controls inline expansion of functions. It must be followed by number 0, 1 or 2.

0 Disables inline expansions. By default, expansion occurs at the compiler's discretion on all functions, often referred to as auto-inlining.

1 Allows expansion only of functions marked inline, __inline, or __forceinline, or in a C++ member function defined in a class declaration.

2 The default value. Allows expansion of functions marked as inline, __inline, or __forceinline, and any other function that the compiler chooses.

/Ob2 is in effect when /O1, /O2 (Minimize Size, Maximize Speed) or /Ox (Enable Most Speed Optimizations) is used.

This option requires that you enable optimizations using /O1, /O2, /Ox, or /Og.

To set this compiler option in the Visual Studio development environment

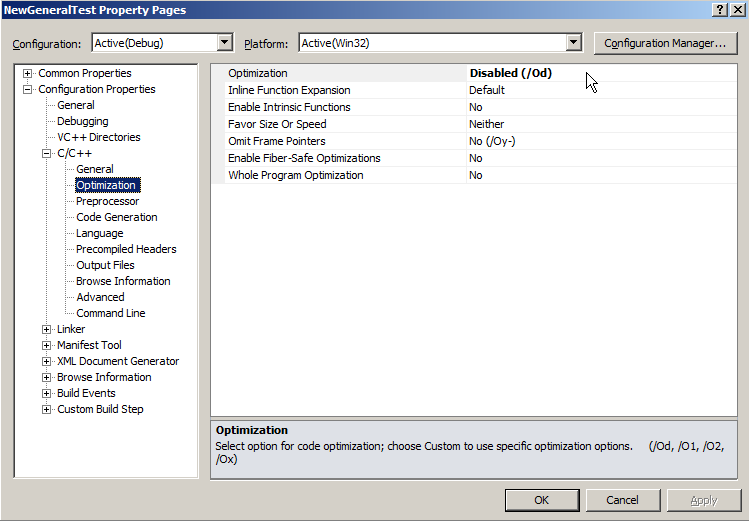
  1. Open the project's Property Pages dialog box. For details, see Working with Project Properties.
  2. Expand Configuration Properties, C/C++, and select Optimization.
  3. Modify the Inline Function Expansion property.

enter image description here

For more information read the article /Ob (Inline Function Expansion)

Capricorn answered 3/12, 2017 at 4:49 Comment(3)
While this of course makes the profiling results "prettier", they also become meaningless. Disabling inlining in C++ is going to drastically change the performance characteristics of a lot of code, most notably when using templates (containers, anyone?).Argol
@Argol Yes, you right at that point of view. But all times will be changed relatively to each over and relations of function total results will be close to real results. I suppose it should not be a final profiling iteration. After inline functions have been profiled and optimized, man should return inline expansions again.Capricorn
@S.M.: What you are claiming is not true. Functions that use templates heavily will be punished severely, whereas functions that don't, won't show any speed difference. This will confuse novices, and make them once again believe a C array are faster than using a vector for example... You could also claim that a debug build will be homogenously slower than a release build, but that is also not true at all.Argol

© 2022 - 2024 — McMap. All rights reserved.