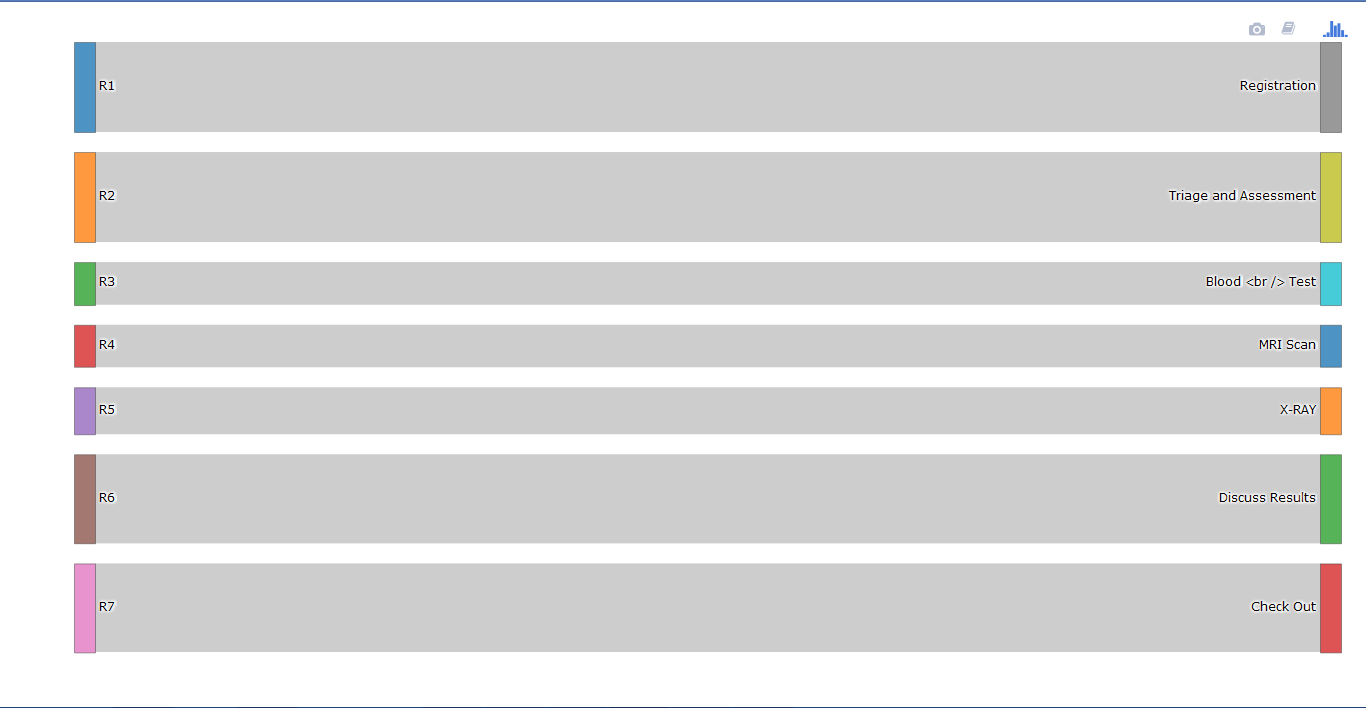
kindly run the script below, I have created a Sankey chart in R and plotly using data from "patients" dataset of the bupaR library. Please see the snapshot for reference. The issue I am facing is that, this custom plot has been built by declaring and building each and every relationship between users("r1","r2",etc.) and activities("Registration","X-Ray, etc). If I have a large number of users and activities, it will become a very tedious task to declare each and every relation. Please help me in modifying the plot dynamically such that I can replicate the code for large number of users and activities.
library(plotly)
library(bupaR)
value1 =  nrow(subset(patients, handling == "Registration" & employee ==
"r1"))
value2 =  nrow(subset(patients, handling == "Triage and Assessment" &
employee == "r1"))
value3 =  nrow(subset(patients, handling == "Check-out" & employee == "r1"))
value4 =  nrow(subset(patients, handling == "Triage and Assessment" &
employee == "r2"))
value5 =  nrow(subset(patients, handling == "Blood test" & employee ==
"r3"))
value6 =  nrow(subset(patients, handling == "Triage and Assessment" &
employee == "r3"))
value7 =  nrow(subset(patients, handling == "X-Ray" & employee == "r3"))
value8 =  nrow(subset(patients, handling == "MRI SCAN" & employee == "r4"))
value9 =  nrow(subset(patients, handling == "X-Ray" & employee == "r4"))
value10 = nrow(subset(patients, handling == "X-Ray" & employee == "r5"))
value11 = nrow(subset(patients, handling == "Discuss Results" & employee ==
"r6"))
value12 =  nrow(subset(patients, handling == "MRI SCAN" & employee == "r6"))
value13 =  nrow(subset(patients, handling == "Check-out" & employee ==
"r7"))

trace1 <- list(
  domain = list(
    x = c(0, 1),
    y = c(0, 1)
  ),
  link = list(
    label = c("Case1", "Case2", "Case3", "Case4", "Case5", "Case6",
  "Case7","Case8", "Case9", "Case10",
              "Case11","Case12", "Case13"),
    source = c(0,0,0,1,2,2,2,3,3,4,5,5,6),
    target = c(7,8,13,8,9,8,11,10,11,11,12,10,13),
    value =
    c(value1,value2,value3,value4,value5,value6,value7,
    value8,value9,value10,value11,value12,value13)
    ),
  node = list(label = c("R1", "R2",
  "R3","R4","R5","R6","R7","Registration","Triage and Assessment","Blood
  Test",
                        "MRI Scan","X-RAY","Discuss Results","Check Out")),
  type = "sankey"
  )
  data <- list(trace1)
  p <- plot_ly()
  p <- add_trace(p, domain=trace1$domain, link=trace1$link,
  node=trace1$node, type=trace1$type)
  p

