This is one way to do it, but there are certainly other good alternatives.
One easy way get hold of a reference to all packages is with ìnstalled.packages(). If you have several libraries and interpreters to separate projects, you can specify the library location for each project with lib.loc. This will give you matrices with packages and their information. One of the columns is "priority". Base packages set this to "recommended" or "base". If you start adding "mine" or somethiing similar to your own, that's an easy way to filter out your own packages.
Fetch the matrix from each library you have by supplying your library paths.
To find your own packages, subtract away the list of packages from the repositories you usually use, eg. for cran mypkgs <- setdiff(installed.packages()[,1], available.packages()[,1]). Then subtract the basepackages, mypkgs <- setdiff(mypkgs, basePkgs). basePkgs is from miniCran and filters based on priority as noted above. You should then have a list of the packages you have built yourself.
Then use makeDepGraph from miniCran. It takes the package name and information on dependencies. You can supply it with installed.packages, or if you have several libraries, just Reduce over the matrices with rbind and remove duplicates. Then plot it with plot.
If you just want to see dependency among your own packages, filter out the other packages as above and supply that to makeDepGraph.
An example: I have a base installation for various R stuff and another library for a current project with an isolated interpreter. Here is an example with the package "flowCore" (not written by me). It is from the Bioconductor repository. For the sake of argument I don't subtract bioconductor packages and assume these are mine to better adress your question.
require("miniCRAN")
#get package info
inst<-installed.packages()
other_inst<-installed.packages("/Users/lovetatting/Desktop/flowproj/lib/R-3.3.0/library")
cran<-available.packages()
#pick out your own packages
mypkgs<-lapply(list(inst, other_inst), function(inst){
  mine<-setdiff(
    setdiff(
      inst[,1], cran[,1]),
    basePkgs())
})
#aggregate
mypkgs<-Reduce(union, mypkgs)
allpkgs<-Reduce(rbind, list(inst, other_inst))

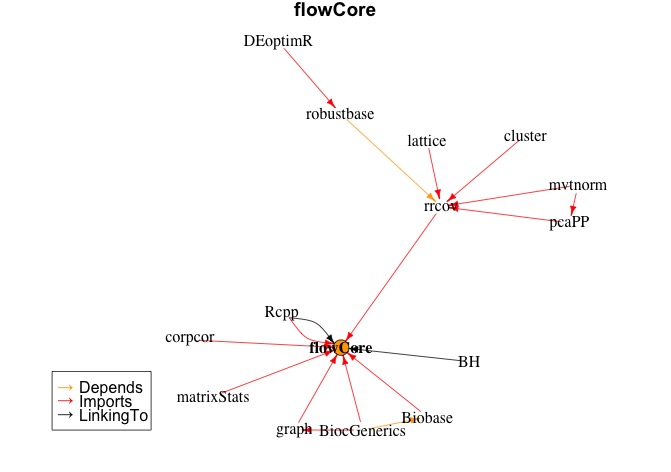
plot(makeDepGraph("flowCore", allpkgs, suggests=F))
This will result in the dependency graph below
![enter image description here]()
If you have more specific requirements on tracking of dependencies, you can always play around with the info form installed.packages. For package development I myself have a small library of bash functions, mainly wrappers around calls for R CMD ... and devtools. But also for taking care of annoyances such as the restriction of folder hierarchy in the R folder (I bundle everything, and install that).

