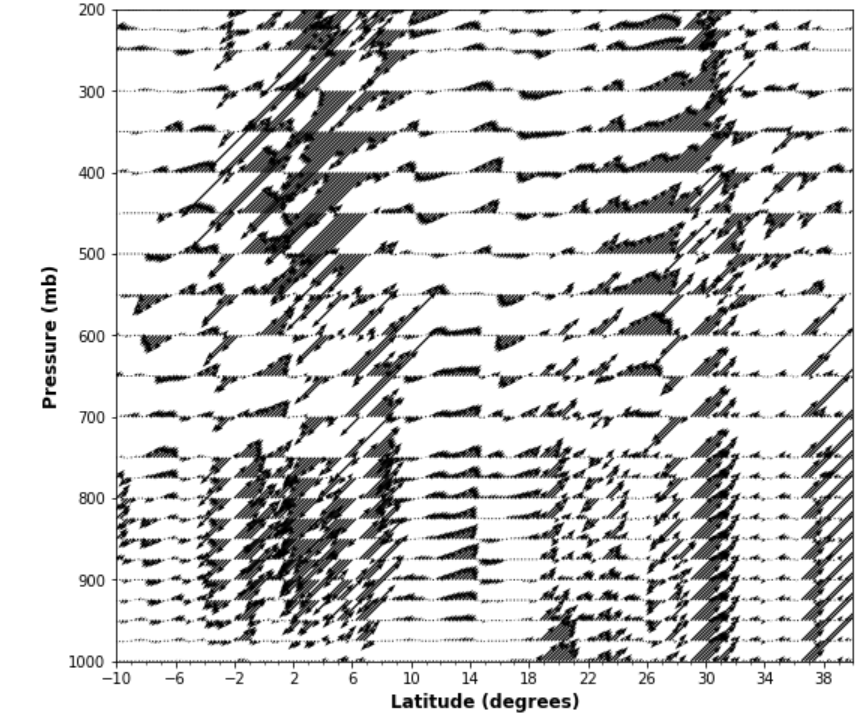
I have vertical wind data in masked array format, which I want to plot it into vector form.
masked_array(
  data=[[-4.06932000e-04, -4.06932000e-04, -5.70601827e-04, ...,
         -2.43262173e-04, -2.43262173e-04, -4.06932000e-04],
        [-1.38895096e-03, -8.97941481e-04, -5.70601827e-04, ...,
         -4.06932000e-04, -7.95923461e-05,  2.47747308e-04],
        [ 2.47747308e-04,  5.75086961e-04,  1.22976627e-03, ...,
          7.38756788e-04,  4.11417135e-04,  8.40774808e-05],
        ...,
        [ 5.50771393e-02,  3.57640997e-02,  5.21310824e-02, ...,
         -4.98352197e-02, -2.95401612e-02, -3.90330111e-02],
        [ 6.03145738e-02,  3.28180429e-02,  4.96760350e-02, ...,
         -2.65941043e-02, -2.38117172e-02, -3.33045672e-02],
        [ 5.75321867e-02,  3.34727222e-02,  4.95123652e-02, ...,
          5.97619125e-03,  5.32151194e-03,  2.53912488e-03]],
  mask=False,
  fill_value=1e+20)
I have tried in the following way:
import matplotlib.pyplot as plt
import numpy as np
from netCDF4 import Dataset as ncfile
import cartopy.crs as ccrs

nc = ncfile('data.nc')

lats = nc.variables['latitude'][:]
p = nc.variables['level'][:]

w = (nc.variables['w'][0,:,:,95])


fig = plt.figure(figsize=(11, 8))
ax1 = fig.add_subplot(111)

ax1.axis([-10, 40, 1000, 200])
ax1.yaxis.get_ticklocs(minor=True)
ax1.minorticks_on()
ax1.tick_params(direction='out', which='both')
ax1.set_xlabel('Latitude (degrees)', fontsize=12, fontweight='bold')
ax1.set_ylabel('Pressure (mb)', fontsize=12, fontweight='bold')
ax1.set_xticks(np.arange(-10, 40, 4))
ax1.set_yticks([1000, 900, 800, 700, 600, 500, 400, 300, 200])

#-- vertical wind vector
plt.quiver(lats, p, w, w, scale=10)

plt.savefig('sample.png')
It displays in the following way, but I want it into equally spaced or **stream ** form.

