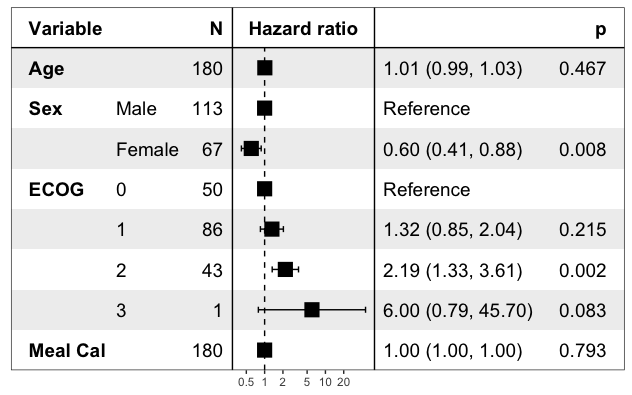
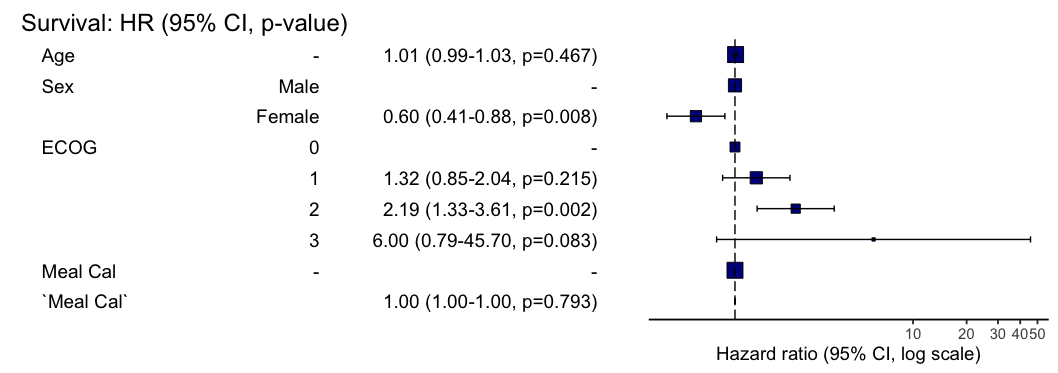
Currently my forest plots for subgroup analysis (not for meta-analysis) in R are like the following...
library("dplyr")
library(ggplot2)
library(survminer)
library(survival)
library(forestmodel)

pretty_lung <- lung %>%
  transmute(time,
            status,
            Age = age,
            Sex = factor(sex, labels = c("Male", "Female")),
            ECOG = factor(lung$ph.ecog),
            `Meal Cal` = meal.cal)

print(forest_model(coxph(Surv(time, status) ~ ., pretty_lung)))
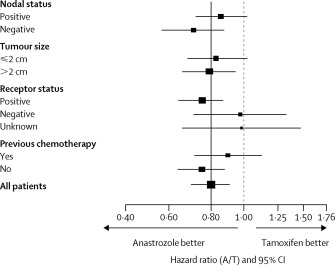
However, the sizes/heights of the squares are not proportional to the subgroup sample size. In other words, I would expect that the smaller the confidence interval, the larger the boxes/squares would be. Is there a way to fix that (as in this example: https://www.thelancet.com/journals/lancet/article/PIIS0140-6736(05)61026-4/fulltext)?


