atos and dwarfdump won't symbolicate my address
Asked Answered
F

6

14

I received a crash report via AirBrake.io that isn't symbolicated. Since the crash report is not in exactly the same format as an Apple crashlog I can't just drop it on XCode as usual, so I took the exact same build from my XCode archive tried to symbolicate it on the commandline. With the following result:

$ atos -o kidsapp.app/kidsapp 0x0002fc4c
0x0002fc4c (in kidsapp)

I'm absolutely sure I'm using the same build as the crash report is from. So I also tried with dwarfdump:

$ dwarfdump --lookup 0x0002fc4c --arch armv7 kidsapp.app.dSYM
----------------------------------------------------------------------
 File: kidsapp.app.dSYM/Contents/Resources/DWARF/kidsapp (armv7)
----------------------------------------------------------------------
Looking up address: 0x000000000002fc4c in .debug_info... not found.
Looking up address: 0x000000000002fc4c in .debug_frame... not found.

Also no result. Is there anything else besides using the wrong dSYM file that I could do wrong? I know it's the correct one since this is the version referred in the crash report in AirBrake and it's in my XCode archive.

Any ideas/tips are welcome!

Finegrained answered 20/4, 2012 at 8:30 Comment(0)
I
9

First of all check if the dSYM is really the correct one for that app:

dwarfdump --uuid kidsapp.app/kidsapp
dwarfdump --uuid kidsapp.app.dSYM

Both should return the same result.

Next check if the dSYM has any valid content

dwarfdump --all kidsapp.app.dSYM

This should give at least some info, other than not found.

I guess that the dSYM is corrupt. In general you might want to use a crash reporter that gives you a full crash report with all threads and last exception backtrace information. I recommend using something based on PLCrashReporter, e.g. QuincyKit (Open Source SDK + Server + symbolication on your mac) or HockeyApp (Open Source SDK + Paid service + server side symbolication) (Note: I am one of the developers both!)

Isolda answered 23/4, 2012 at 12:7 Comment(7)
I'm having the same issue. I have a crash reported that provides the stack trace but none of the symbols from my project that end up in the stack can be found in my archive's dSYM. The UUIDs match but the symbols are all off. How is this possible and how can I resolve this? Does apple modify the binary somehow before releasing to the app store thus corrupting the alignment with my dSYM?Greyhen
You'll have to take the slide of the binary and the start address of the app into account. You can't just use the memory address from the stack trace. Just use the symbolicatecrash script from Xcode which does all of what you'll need.Isolda
But if all i have are the symbols (I should have said stack dump, not trace) which purely gives me hex values how do I take the "slide" into account?Greyhen
address for using with atos = slide + stack address - binary load address. You get the slide with dwarfdump from the dsym or binary, check how the symbolicatecrash script does it. binary load address you get from the binary images section in the crash report.Isolda
I answered to my specific subproblem.Greyhen
In the first step, the architecture returned for the first line is armv7 but for the second (dSYM) it's armv7s. Is this a problem?Means
No, this is not a problem and can happen if an app only has an armv7 slice in the binary, but the system doesn't have armv7 but armv7s (e.g. the iPhone 5S).Isolda
G
30

I used the following arithmetic to figure it out:

slide + stack address - load address = symbol address

and

stack address is the hex value I get from my stack dump crash report (not a .crash file, just the stack dump).

and

slide is the vmaddr of the LC_SEGMENT cmd when running otool -arch armv7 -l APP_BINARY_PATH. Mine usually ends up being 0x00001000.

and

load address is the complicated piece. It is actually the difference between the bottommost stack address of the main thread and the FIRST address of the portion of my binary that contains symbols when running dwarfdump --arch armv7 --all DSYM_BINARY_PATH. This is simply the symbolic address of the main function. So if your bottom most crash address is 0x8000 and your main function's symbolic address is 0x2000 then your load address is 0x6000.

Now with ALL these pieces I can calculate the symbol address and put that into atos or dwarfdump: dwarfdump --lookup SYM_ADDR --arch armv7 APP_BINARY_PATH.

Example of the dump (you can see that the load address was 0x00003af4):

----------------------------------------------------------------------

File: /Users/user/Desktop/MyApp.xcarchive/dSYMs/MyApp.app.dSYM/Contents/Resources/DWARF/MyApp (armv7)

----------------------------------------------------------------------

0x00000024: [0x00003af4 - 0x00003b4e) main

0x00000098: [0x00003b50 - 0x00003d8c) -[MyAppDelegate application: didFinishLaunchingWithOptions:]

... the rest of the dump

The hardest part was realizing that one of the 2 static libraries I'd included had their symbols stripped before being link to my app's binary! That left a HUGE gap of symbol addresses so I only ended up with two-thirds of the symbols I needed in my dSYM.

Be sure to have the following flags set to NO in your static libraries xcode project so that when you link against it, you can pull in the symbols to your app's binary (which can later be stripped): COPY_PHASE_STRIP, DEAD_CODE_STRIPPING, and STRIP_INSTALLED_PRODUCT.

Now you may ask, "what do I do if the stack dump does not include the main function since it isn't on the main thread so that I cannot get the main function's stack address?". To that I would reply, "I haven't a friggin' clue!". Just cross your fingers and hope you can get a stack trace that includes the symbol address or use a crash reporting system that mimics Apple's crash logs, like PLCrashReporter.

[EDIT May 26, 2013] -

It was brought to my attention that the load address is really the address of the mach-o binary. Though what I described above can often work - it's not actually correct. This can be obtained via the CRASH REPORT, however the point of this answer was to provide the symbols of a crash when you don't have a crash report. The best way I've come to figuring out the load address when wanting to symbolicate is by making sure I log the load address with the stack addresses.

I've personally created a system for logging crashes (not crash reports) and having them sent to an S3 bucket where I can retrieve them later for debugging. When I start my application I cache the slide, the load address and the main function address for use if my app crashes and I send up a the stack addresses.

NOTE: the dyld functions use #include <mach-o/dyld.h>

slide = the address returned by _dyld_get_image_vmaddr_slide(0)

load address = the address returned by _dyld_get_image_header(0)

main function address = the last address in [NSThread callStackReturnAddresses] when called on the main thread

At crash time I'm sure to log [NSThread callStackReturnAddresses] and [NSThread callStackSymbols] as well as the architecture which can be retrieve by having this method:

- (NSString*) arch
{
    NSString* arch =
#ifdef _ARM_ARCH_7
        @"armv7";
#elif defined (_ARM_ARCH_6)
        @"armv6";
#else
        nil;
#endif

    return arch;
}

I don't yet know how to differentiate between armv7 and armv7s though.

So this may help in the future. I plan on taking everything I've learned and turning this into a simple crash tool - better than the natos tool (probably natos v2).

I've updated natos to support supplying the load address manually: https://github.com/NSProgrammer/natos

Greyhen answered 17/9, 2012 at 17:55 Comment(7)
I've created a command line tool to do all the hard work. Simply need 1) the xcarchive path, 2) the stack address symbol of the main function, 3) the stack address of the desired symbol, 4) the architecture of interest. It's located on github: github.com/nob1984/natosGreyhen
Nice writeup, but sadly there is a major mistake in it: the load address is NOT what you wrote. The load address can be found in the binary images section of the crash report and is the start address of the address range of the corresponding binary.Isolda
I used your tools, but how can I get the _mainFunctionStackAddress? I find an address by dwarfdump my dsym file and used it, but the result he gives me was the same with the atos explained, I still can't find the right position of the crash point.Latten
@Zhou, the tool has been updated to accept just the load address instead of calculating based on the main function stack address.Greyhen
@NSProgrammer, I tried with natos but its not giving me the right function.Pilose
@Greyhen Thank you! This tool works for 32-bit builds well. I just sent to you a PR on github which provides 64-bit arch support for this tool.Brigham
@AntonGaenko PR mergedGreyhen
I
9

First of all check if the dSYM is really the correct one for that app:

dwarfdump --uuid kidsapp.app/kidsapp
dwarfdump --uuid kidsapp.app.dSYM

Both should return the same result.

Next check if the dSYM has any valid content

dwarfdump --all kidsapp.app.dSYM

This should give at least some info, other than not found.

I guess that the dSYM is corrupt. In general you might want to use a crash reporter that gives you a full crash report with all threads and last exception backtrace information. I recommend using something based on PLCrashReporter, e.g. QuincyKit (Open Source SDK + Server + symbolication on your mac) or HockeyApp (Open Source SDK + Paid service + server side symbolication) (Note: I am one of the developers both!)

Isolda answered 23/4, 2012 at 12:7 Comment(7)
I'm having the same issue. I have a crash reported that provides the stack trace but none of the symbols from my project that end up in the stack can be found in my archive's dSYM. The UUIDs match but the symbols are all off. How is this possible and how can I resolve this? Does apple modify the binary somehow before releasing to the app store thus corrupting the alignment with my dSYM?Greyhen
You'll have to take the slide of the binary and the start address of the app into account. You can't just use the memory address from the stack trace. Just use the symbolicatecrash script from Xcode which does all of what you'll need.Isolda
But if all i have are the symbols (I should have said stack dump, not trace) which purely gives me hex values how do I take the "slide" into account?Greyhen
address for using with atos = slide + stack address - binary load address. You get the slide with dwarfdump from the dsym or binary, check how the symbolicatecrash script does it. binary load address you get from the binary images section in the crash report.Isolda
I answered to my specific subproblem.Greyhen
In the first step, the architecture returned for the first line is armv7 but for the second (dSYM) it's armv7s. Is this a problem?Means
No, this is not a problem and can happen if an app only has an armv7 slice in the binary, but the system doesn't have armv7 but armv7s (e.g. the iPhone 5S).Isolda
M
4

For whom that certain times doesn't have the value for Load Address like this:

Jan 14 11:02:39 Dennins-iPhone AppName[584] <Critical>: Stack Trace: (
    0   CoreFoundation                      0x2c3084b7 <redacted> + 150
    1   libobjc.A.dylib                     0x39abec8b objc_exception_throw + 38
    2   CoreFoundation                      0x2c21cc35 CFRunLoopRemoveTimer + 0
    3   AppName                             0x0005a7db AppName + 272347  

I've created a simple bash to help me debug:

#! /bin/bash
read -p "[Path] [App Name] [Stack Address] [Relative Address] " path appName runtimeAddress relativeAddress
loadAddress=`echo "obase=16;ibase=10;$((runtimeAddress-relativeAddress))" | bc`
atos -o $path/Payload/$appName.app/$appName -l $loadAddress $runtimeAddress -arch armv7

It just reads the path for the app, the app name, the runtime address, and the value after "+" signal (the decimal value) and then find the value for load address to run atos command.

Manstopper answered 14/1, 2015 at 16:36 Comment(1)
thanks a lot! I have stack traces without load address and your script was the only way to derive load address from runtime and relative addressesMedlock
K
3

So my case: I'm receiving the crash strings out of the NSException.callStackSymbols.

The crash stack trace looks this way:

2   AppName                               0x00000001006c75b4 AppName + 2356660\r3   AppName                               0x00000001004f5cfc AppName + 449788\r4   UIKit                               0x000000018c0a8968 \u003credacted\u003e + 108\r5   UIKit      0x000000018c0a9328 \u003credacted\u003e + 28\r6   UIKit                               0x000000018beea250 \u003credacted\u003e + 1320\r7   UIKit                               0x000000018beede98 \u003credacted\u003e + 188\r8   UIKit                               0x000000018bcb5820 \u003credacted\u003e + 116\r9   UIKit                               0x000000018bbdec88 \u003credacted\u003e + 760\r10  UIKit                               0x000000018bbde610 \u003credacted\u003e + 312\r11  UIKit                               0x000000018bbde31c \u003credacted\u003e + 296\r12  UIKit                               0x000000018bbde3bc \u003credacted\u003e + 456\r13  QuartzCore                          0x0000000185b93b7c \u003credacted\u003e + 284\r14  libdispatch.dylib                   0x00000001811a8a2c \u003credacted\u003e + 16\r15  libdispatch.dylib                   0x00000001811b5654 \u003credacted\u003e + 1012\r16  CoreFoundation                      0x0000000181851650 \u003credacted\u003e + 12\r17  CoreFoundation                      0x000000018184f1a8 \u003credacted\u003e + 2272\r18  CoreFoundation                      0x000000018176f488 CFRunLoopRunSpecific + 552\r19  GraphicsServices                    0x0000000183735020 GSEventRunModal + 100\r20  UIKit         0x000000018bc09cc0 UIApplicationMain + 236\r21  AppName                               0x000000010048f714 AppName + 30484\r22  libdyld.dylib 0x000000018120dfc0 \u003credacted\u003e + 4

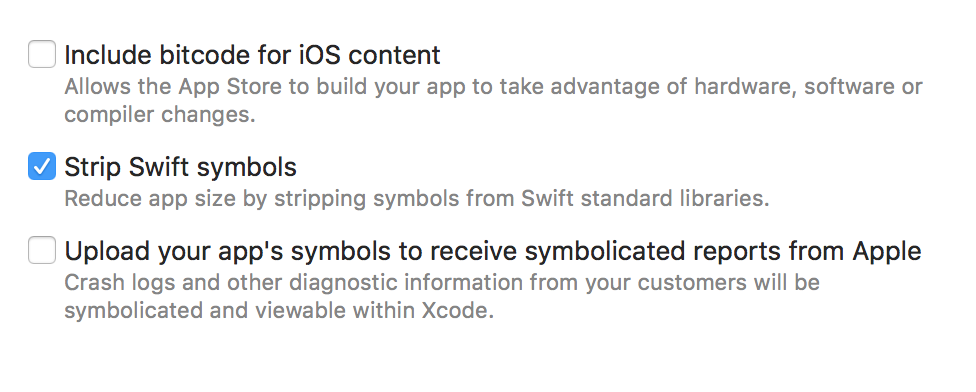
Don't include bitcode, as Apple can recompile your code, and dsym files from your archive in Organizer won't match. enter image description here

Run such bash script:

#!/bin/bash
appName=AppName
runtimeAddress=0x00000001006c75b4
relativeAddress=2356660
loadAddress=`echo "obase=16;ibase=10;$((runtimeAddress-relativeAddress))" | bc`
atos -o $appName.app/$appName -l $loadAddress $runtimeAddress -arch arm64

Assuming, that you've created a test.sh (touch test.sh). If it's not possible to run the sctipt (./test.sh) because of the permissions issue: call chmod +x test.sh Now ./test.sh should work. And generate the result.

enter image description here

As well it's possible to symbolicate the crash file using AppName.app.dSYM file:

#!/bin/bash
appName=AppName
runtimeAddress=0x00000001006c75b4
relativeAddress=2356660
loadAddress=`echo "obase=16;ibase=10;$((runtimeAddress-relativeAddress))" | bc`
atos -o $appName.app.dSYM/Contents/Resources/DWARF/$appName -l $loadAddress $runtimeAddress -arch arm64
Kelpie answered 11/4, 2018 at 12:35 Comment(0)
O
1

I think this post may help you, https://mcmap.net/q/752737/-symbolicate-crash-failed-on-xcode-4-5. Joe's commit soled my problem.

The reason is that my .app and .dSYM files can't be indexed by spotlight, so my XCode can't symbolicate the crash info correctly.

Outnumber answered 10/3, 2013 at 8:15 Comment(0)
T
1

You can try and use a script I wrote for symbolicate using atos command:

https://github.com/IdoTene/MacosSymbolicateCrash

Tellurate answered 11/2, 2018 at 9:4 Comment(0)

© 2022 - 2024 — McMap. All rights reserved.