Manually changing the size of the Bubbles for Plotly Bubble Map in R
Asked Answered
D

1

0

I am currently trying to change the sizes of the Bubbles for Plotly's bubble map manually. I was successful in changing the colors of the map using the data provided but I am unable to use the same logic to change the size. To change the colors I simply called: colors_wanted <- c("red", "blue", "black", "pink") and passed this command to colors within plot_ly. Do you think it is possible to change the sizes rather than using the formula in this case sqrt to claim the sizes?

library(plotly)
df <- read.csv('https://raw.githubusercontent.com/plotly/datasets/master/2014_us_cities.csv')
df$hover <- paste(df$name, "Population", df$pop/1e6, " million")

df$q <- with(df, cut(pop, quantile(pop), include.lowest = T))
levels(df$q) <- paste(c("1st", "2nd", "3rd", "4th"), "Quantile")
df$q <- as.ordered(df$q)

g <- list(scope = 'usa',projection = list(type = 'albers usa'),showland = TRUE,landcolor = toRGB("gray85"),
subunitwidth = 1, countrywidth = 1, subunitcolor = toRGB("white"),countrycolor = toRGB("white"))

plot_ly(df, lon = lon, lat = lat, text = hover,
  marker = list(size = sqrt(pop/10000) + 1, line = list(width = 0)),
  color = q, colors= colors_wanted, type = 'scattergeo', locationmode = 'USA-states') %>%
  layout(title = '2014 US city populations<br>(Click legend to toggle)', geo= g)
Debbi answered 11/9, 2016 at 1:20 Comment(3)
it's unclear to me what you want. Are you trying to format the size according to some variable, are you trying to reduce or increase the size of all bubbles, etc..Spiral
@CyrusMohammadian Hi, Thank you for the response. I am trying to change the sizes of the bubble based on my own metrics. For example, I am able to change all of the sizes of the bubbles to '5' (by making size = 5) but I cannot change the sizes to (1,2,3,4) respect to each quantile as I was able to with the colors. Hopefully that clarifies things.Debbi
@Hack-R Hi, To my understanding, the sqrt(pop/10000) + 1 call changes the sizes of each bubble relative to the quantile. I was hoping to change the sizes of the bubbles without going through the process of finding the optimal size and hopefully hard code it. For example, if the population data were to be raised to the power of two, then I would have to take the fourth root of the population to obtain the same portion of the bubble size.Debbi
O
2

If you want the size to correspond to a quartile then this works (and there are any number of variations on this that you could do to make the size more analytically meaningful):

plot_ly(df, lon = lon, lat = lat, text = hover, size = as.numeric(df$q), 
        #marker = list(size = sqrt(pop/10000) + 1, line = list(width = 0)),
        color = q, colors= colors_wanted, type = 'scattergeo', locationmode = 'USA-states') %>%
  layout(title = '2014 US city populations<br>(Click legend to toggle)', geo= g)
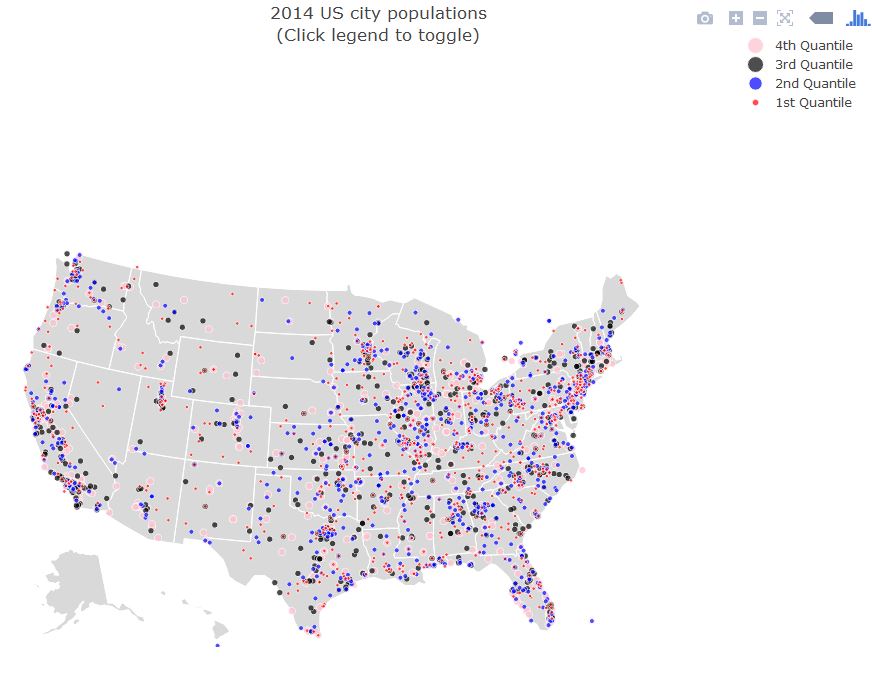
enter image description here

Here's an interesting variation:

plot_ly(df, lon = lon, lat = lat, text = hover, size = aggregate(df$pop,by=list(df$q),sqrt)$x,
        #marker = list(size = sqrt(pop/10000) + 1, line = list(width = 0)),
        color = q, colors= colors_wanted, type = 'scattergeo', locationmode = 'USA-states') %>%
  layout(title = '2014 US city populations<br>(Click legend to toggle)', geo= g)
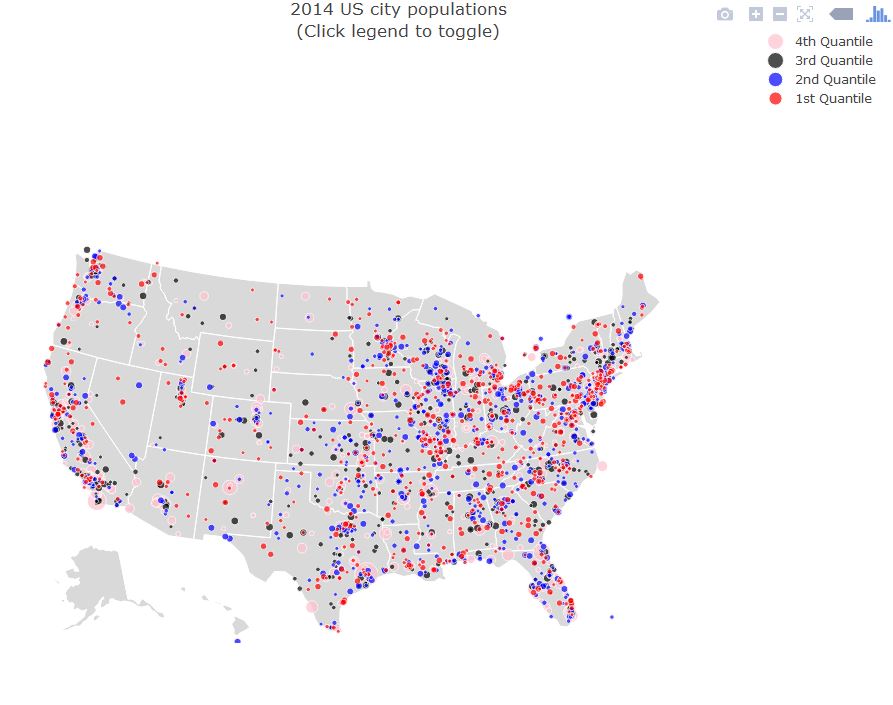
enter image description here

Oppugnant answered 11/9, 2016 at 1:45 Comment(1)
Hi, Thank you! This is what I was hoping to do. Thank you once again for the second save (before with the Choropleth Map). In case you are curious, the reason why I want to hard code this is because I am hoping to use DBSCAN to find clustered areas and then map a single point as a larger and darker bubble to see if all the points that is clustered fall under that large circle (As you also asked a question regarding k-means clustering, I thought it would be interesting to note that as well).Debbi

© 2022 - 2024 — McMap. All rights reserved.