Graph with ordered bars and using facets
Asked Answered
C

2

2

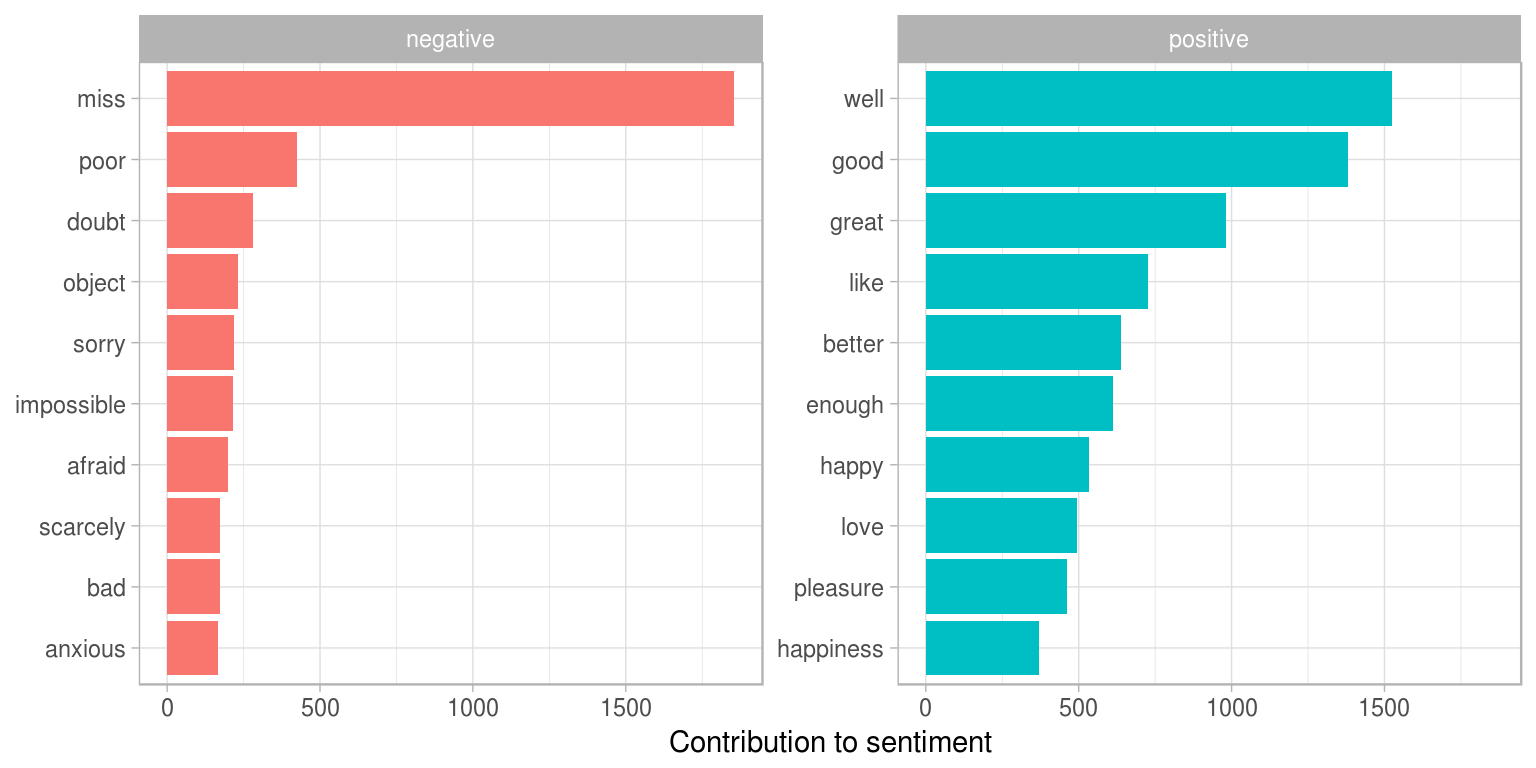
I am trying to make a graph with ordered bars according to frequency and also using a variable two separate two variables using facets. Words have to be ordered by value given in 'n' variable. So, my graph should look like this one which appears in tidytext book: enter image description here
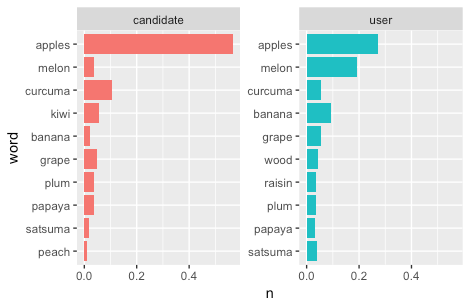
My graph bellow, words are not ordered by value, what is my mistake?: enter image description here My data looks like the one in the example:
> d
# A tibble: 20 x 3
   word    u_c            n
   <chr>   <chr>      <dbl>
 1 apples  candidate 0.567 
 2 apples  user      0.274 
 3 melon   user      0.191 
 4 curcuma candidate 0.105 
 5 banana  user      0.0914
 6 kiwi    candidate 0.0565
 ...

Following the code provided in the book and modifying it according to my data, the code looks like this:

d %>% 
  mutate(word = reorder(word, n)) %>%
  ggplot(aes(word, n, fill = u_c)) + 
  geom_col(show.legend = F) +
  facet_wrap(~u_c, scales = "free_y") +
  coord_flip()

Here is the dput for d:

d <- structure(list(word = c("apples", "apples", "melon", "curcuma", 
                             "banana", "kiwi", "grape", "curcuma", "grape", 
                             "wood", "satsuma", "melon", "raisin", "papaya", "plum", 
                             "plum", "papaya", "banana", "satsuma", "peach"), u_c = c("candidate", 
                                                                                      "user", "user", "candidate", "user", "candidate", "user", "user", 
                                                                                      "candidate", "user", "user", "candidate", "user", "candidate", 
                                                                                      "candidate", "user", "user", "candidate", "candidate", "candidate"
                             ), n = c(0.56704584625991, 0.273789875549109, 0.190633674260422, 
                                         0.105308514305412, 0.0914084706627656, 0.0565322302654257, 0.0562029558128485, 
                                         0.0547338017954938, 0.0498104102033781, 0.0439600056682254, 0.0393399851625864, 
                                         0.0380903136849362, 0.0370685271783074, 0.0370561875215443, 0.035849706997587, 
                                         0.0352763676677753, 0.0325506180866405, 0.0206825232678387, 0.0198207514650121, 
                                         0.0113753877973113)), class = c("tbl_df", "tbl", "data.frame"
                                         ), row.names = c(NA, -20L))
Cauchy answered 16/5, 2018 at 16:51 Comment(2)
This is in fact an issue: github.com/tidyverse/ggplot2/issues/1902 but has been solved by David Robinson here: github.com/dgrtwo/drlib/blob/master/R/reorder_within.RSmelser
Thanks for the info, but I can't understand the next steps, this solution is kind of "magicky" as @Cpak metioned ^ ^.Cauchy
C
1

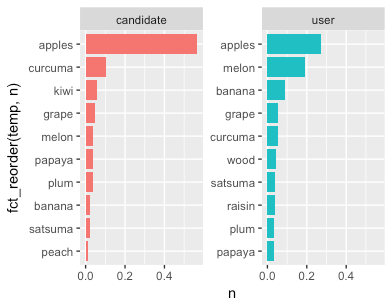
Given the info provided by @GordonShumway and following the answer given by @CPak, bellow I provide the entire and "tricky" and no-elegant way to fix this issue. The almost entire answer (by @CPak) and one more line finally fix the problem:

d %>%
  mutate(temp = paste(word, u_c, sep = "_")) %>%
  ggplot(aes(x = fct_reorder(temp, n), y = n, fill = u_c)) +
  geom_col(show.legend = F) +
  scale_x_discrete(labels = function(x) str_replace(x,"_candidate|_user", "")) +
  facet_wrap(~u_c, scales = "free_y") + 
  coord_flip()

enter image description here

Thanks for the answers!

Cauchy answered 16/5, 2018 at 17:40 Comment(0)
A
1

The very relevant comment aside by GordonShumway (because the solution offered there is a little black magicky) - you can create a temporary value to reorder your facet - note I'm using forcats::fct_reorder rather than reorder

library(tidyverse)
d %>%
  mutate(temp = paste0(word, u_c)) %>%
  ggplot(aes(x = fct_reorder(temp, n), y = n, fill = u_c)) +
  geom_col(show.legend = F) +
  facet_wrap(~u_c, scales = "free_y") + 
  coord_flip()
Allineallis answered 16/5, 2018 at 17:17 Comment(2)
The only issue is that your x-axis tick labels aren't quite right - you'll have to edit them through the themesAllineallis
Adding this: scale_x_discrete(labels = function(x) str_replace(x,"_candidate|_user", "")) solves the problem in a fast but no-elegant way...Cauchy
C
1

Given the info provided by @GordonShumway and following the answer given by @CPak, bellow I provide the entire and "tricky" and no-elegant way to fix this issue. The almost entire answer (by @CPak) and one more line finally fix the problem:

d %>%
  mutate(temp = paste(word, u_c, sep = "_")) %>%
  ggplot(aes(x = fct_reorder(temp, n), y = n, fill = u_c)) +
  geom_col(show.legend = F) +
  scale_x_discrete(labels = function(x) str_replace(x,"_candidate|_user", "")) +
  facet_wrap(~u_c, scales = "free_y") + 
  coord_flip()

enter image description here

Thanks for the answers!

Cauchy answered 16/5, 2018 at 17:40 Comment(0)

© 2022 - 2024 — McMap. All rights reserved.