Google Chart too narrow in Foundation 6
Asked Answered
N

1

1

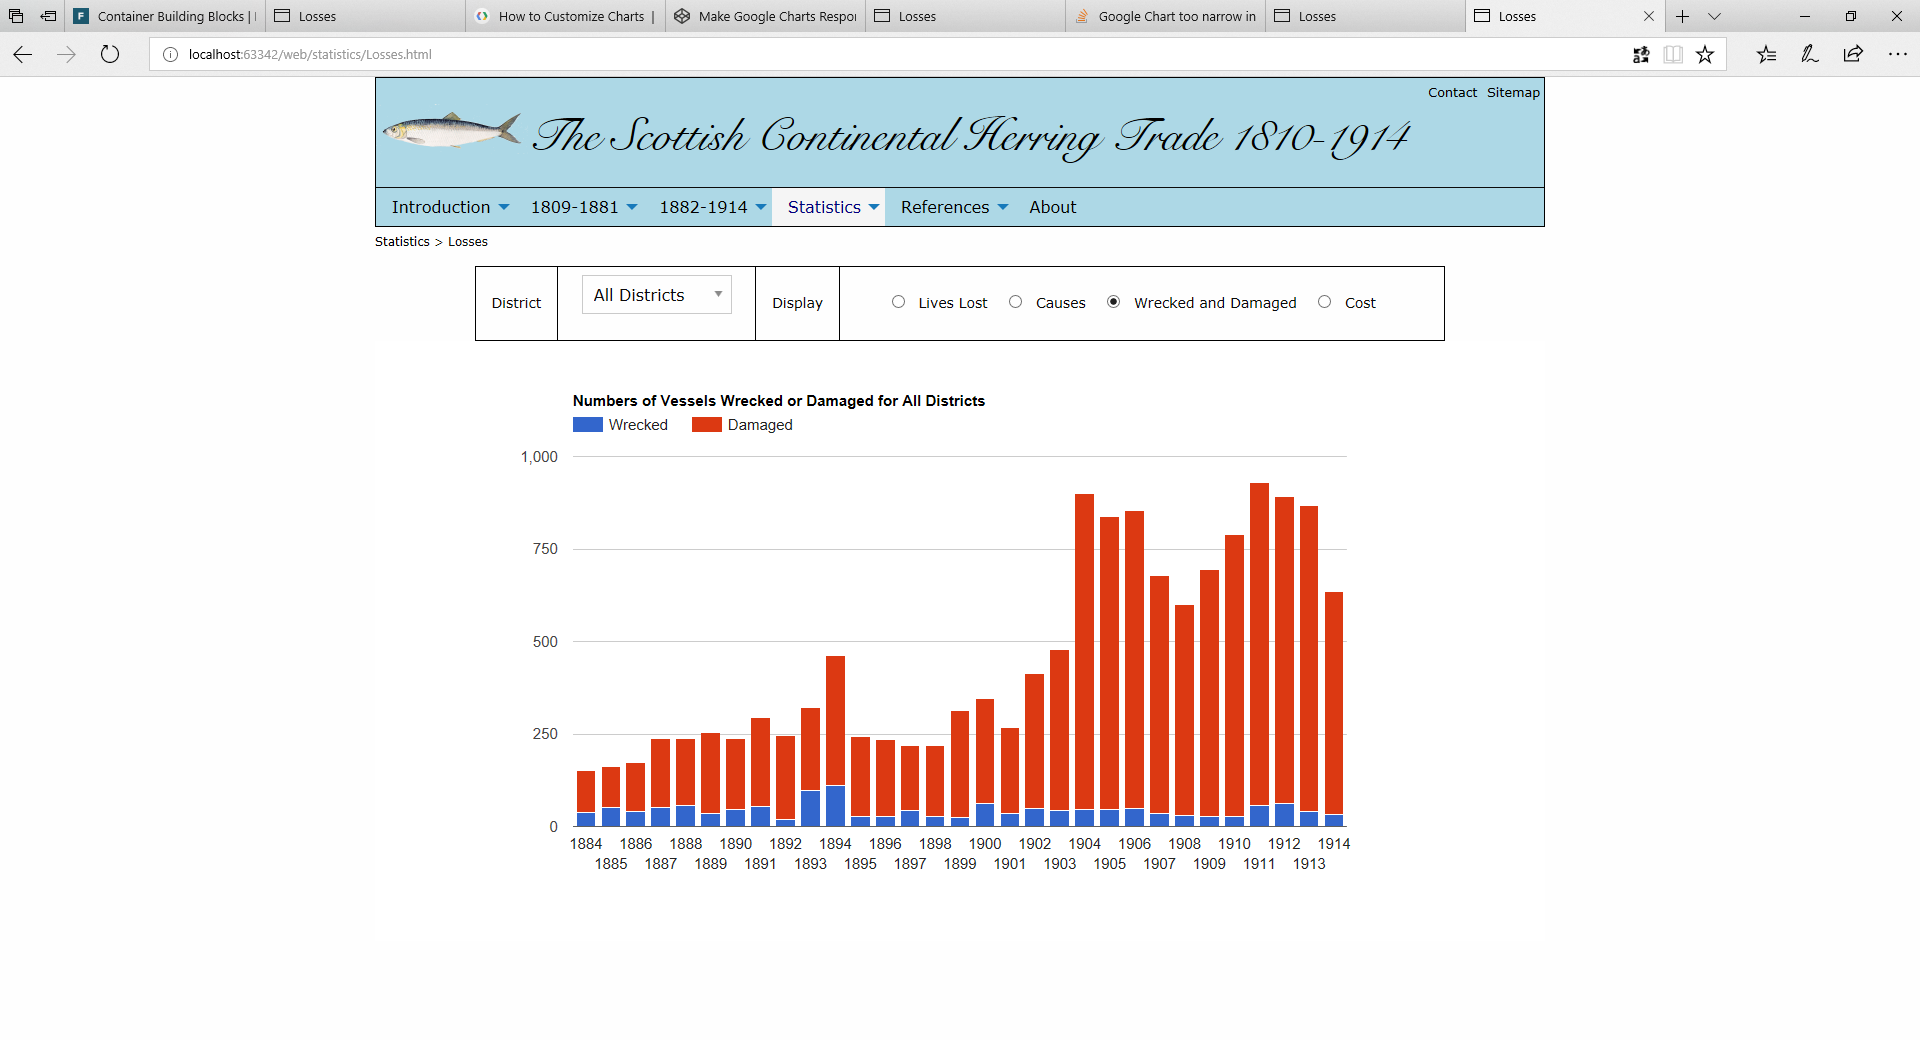
I am trying to convert my website to use Foundation 6. Most of it works OK, but I have a problem with Google charts. I have put my chart inside large-12 cell:

<div class="large-12 cell">
            <div id="chart_div">
            </div>
 </div>

but the chart is too narrow - it should be as wide as the top menu: enter image description here

Nariko answered 5/3, 2018 at 19:52 Comment(2)
Here is the code: var options = { title: caption, height: 600, legend: {position: legendPosition}, bar: {groupWidth: '75%'}, isStacked: stacked }; var chart = new google.visualization.ColumnChart(document.getElementById("chart_div")); chart.draw(statsData, options);Nariko
I should also mention that I use d3.js to read in the data. The form is very similar to my live version which you can see in scottishherringhistory.uk/statistics/Losses.htmlNariko
E
4

by default, the chart does not fully fill the width of the container
see cyan section in following snippet...

google.charts.load('current', {
  packages: ['corechart']
}).then(function () {
  var statsData = new google.visualization.DataTable();
  statsData.addColumn('number', 'x');
  statsData.addColumn('number', 'y');
  statsData.addRows([
    [0, 0],   [1, 10],  [2, 23],  [3, 17],  [4, 18],  [5, 9],
    [6, 11],  [7, 27],  [8, 33],  [9, 40],  [10, 32], [11, 35],
    [12, 30], [13, 40], [14, 42], [15, 47], [16, 44], [17, 48],
    [18, 52], [19, 54], [20, 42], [21, 55], [22, 56], [23, 57],
    [24, 60], [25, 50], [26, 52], [27, 51], [28, 49], [29, 53],
    [30, 55], [31, 60], [32, 61], [33, 59], [34, 62], [35, 65],
    [36, 62], [37, 58], [38, 55], [39, 61], [40, 64], [41, 65],
    [42, 63], [43, 66], [44, 67], [45, 69], [46, 69], [47, 70],
    [48, 72], [49, 68], [50, 66], [51, 65], [52, 67], [53, 70],
    [54, 71], [55, 72], [56, 73], [57, 75], [58, 70], [59, 68],
    [60, 64], [61, 60], [62, 65], [63, 67], [64, 68], [65, 69],
    [66, 70], [67, 72], [68, 75], [69, 80]
  ]);

  var options = {
    backgroundColor: 'cyan',
    colors: ['magenta'],
    title: 'title',
    height: 600,
    legend: {
      position: 'bottom'
    },
    bar: {
      groupWidth: '75%'
    },
    isStacked: false
  };

  var chart = new google.visualization.ColumnChart(document.getElementById('chart_div'));
  chart.draw(statsData, options);
});
<script src="https://www.gstatic.com/charts/loader.js"></script>
<div id="chart_div"></div>

use chartArea options to stretch the chart to the edges of the container,
use top, left, bottom, right to leave room for the axis labels, title, etc.

chartArea: {
  height: '100%',
  width: '100%',
  top: 48,
  left: 48,
  right: 16,
  bottom: 48
},

redraw the chart on 'resize' to make it responsive...

see following working snippet...

google.charts.load('current', {
  packages: ['corechart']
}).then(function () {
  var statsData = new google.visualization.DataTable();
  statsData.addColumn('number', 'x');
  statsData.addColumn('number', 'y');
  statsData.addRows([
    [0, 0],   [1, 10],  [2, 23],  [3, 17],  [4, 18],  [5, 9],
    [6, 11],  [7, 27],  [8, 33],  [9, 40],  [10, 32], [11, 35],
    [12, 30], [13, 40], [14, 42], [15, 47], [16, 44], [17, 48],
    [18, 52], [19, 54], [20, 42], [21, 55], [22, 56], [23, 57],
    [24, 60], [25, 50], [26, 52], [27, 51], [28, 49], [29, 53],
    [30, 55], [31, 60], [32, 61], [33, 59], [34, 62], [35, 65],
    [36, 62], [37, 58], [38, 55], [39, 61], [40, 64], [41, 65],
    [42, 63], [43, 66], [44, 67], [45, 69], [46, 69], [47, 70],
    [48, 72], [49, 68], [50, 66], [51, 65], [52, 67], [53, 70],
    [54, 71], [55, 72], [56, 73], [57, 75], [58, 70], [59, 68],
    [60, 64], [61, 60], [62, 65], [63, 67], [64, 68], [65, 69],
    [66, 70], [67, 72], [68, 75], [69, 80]
  ]);

  var options = {
    backgroundColor: 'cyan',
    colors: ['magenta'],

    // set chart area size
    chartArea: {
      height: '100%',
      width: '100%',
      top: 48,
      left: 48,
      right: 16,
      bottom: 48
    },
    height: '100%',
    width: '100%',

    title: 'title',
    legend: {
      position: 'bottom'
    },
    bar: {
      groupWidth: '75%'
    },
    isStacked: false
  };

  var chart = new google.visualization.ColumnChart(document.getElementById('chart_div'));

  drawChart();
  window.addEventListener('resize', drawChart, false);
  function drawChart() {
    chart.draw(statsData, options);
  }

});
html, body {
  height: 100%;
  margin: 0px 0px 0px 0px;
  padding: 0px 0px 0px 0px;
}

#chart_div {
  height: 600px;
}
<script src="https://www.gstatic.com/charts/loader.js"></script>
<div id="chart_div"></div>
Entire answered 8/3, 2018 at 17:9 Comment(1)
This has completely solved the problem I was experiencing. Thank you!Nariko

© 2022 - 2024 — McMap. All rights reserved.